
Compare Kinetic Engg. with Similar Stocks
Dashboard
Weak Long Term Fundamental Strength with a -187.79% CAGR growth in Operating Profits over the last 5 years
- Company's ability to service its debt is weak with a poor EBIT to Interest (avg) ratio of -0.09
- The company has been able to generate a Return on Equity (avg) of 5.28% signifying low profitability per unit of shareholders funds
Flat results in Mar 26
Risky - Negative Operating Profits
Stock DNA
Auto Components & Equipments
INR 719 Cr (Micro Cap)
375.00
37
0.00%
0.21
1.20%
4.60
Total Returns (Price + Dividend) 
Kinetic Engg. for the last several years.
Risk Adjusted Returns v/s
Returns Beta

News

Kinetic Engineering Ltd is Rated Strong Sell
Kinetic Engineering Ltd is rated Strong Sell by MarketsMOJO, with this rating last updated on 04 Mar 2026. However, the analysis and financial metrics discussed here reflect the stock’s current position as of 23 June 2026, providing investors with an up-to-date view of the company’s fundamentals, returns, and market standing.
Read full news article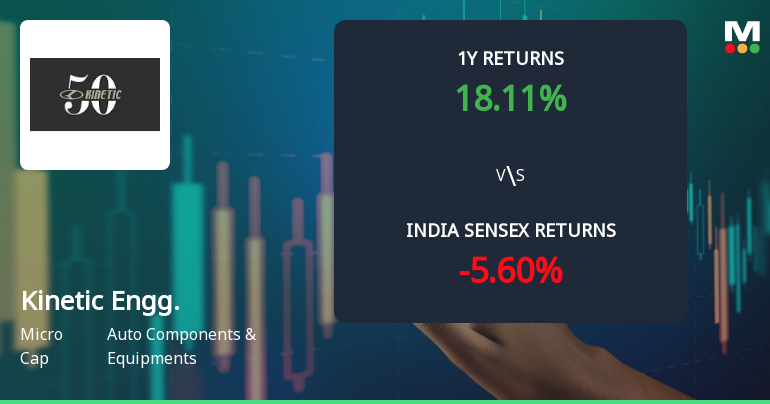
Kinetic Engineering Ltd Sees Mixed Technical Signals Amid Price Momentum Shift
Kinetic Engineering Ltd has experienced a notable shift in price momentum, reflected in a 15.75% surge in daily price change, moving the stock from a mildly bearish to a sideways technical trend. Despite this recent rally, the company’s overall technical indicators present a complex picture, with mixed signals from MACD, RSI, moving averages, and other momentum oscillators, underscoring the challenges faced by investors in the auto components sector.
Read full news article
Kinetic Engineering Ltd is Rated Strong Sell
Kinetic Engineering Ltd is rated Strong Sell by MarketsMOJO, with this rating last updated on 04 March 2026. However, the analysis and financial metrics discussed here reflect the stock’s current position as of 12 June 2026, providing investors with an up-to-date view of the company’s fundamentals, valuation, financial trends, and technical outlook.
Read full news article Announcements
Closure of Trading Window
22-Jun-2026 | Source : BSEIntimation of Closure of Trading Window for quarter ending June 30 2026.
Announcement under Regulation 30 (LODR)-Investor Presentation
18-Jun-2026 | Source : BSEPlease find enclosed herewith the Investor Presentation.
Announcement under Regulation 30 (LODR)-Newspaper Publication
31-May-2026 | Source : BSEExtract of Audited Financial Results - March 31 2026.
Corporate Actions

No Upcoming Board Meetings

No Dividend history available

No Splits history available

No Bonus history available

No Rights history available
Quality key factors
Valuation key factors
Technicals key factors
 Technical Indicator Scale: Bearish, Mildly Bearish, Sideways, Mildly Bullish, Bullish Turned
 Shareholding Snapshot : Mar 2026
Shareholding Compare (%holding)
Promoters
None
Held by 9 Schemes (0.0%)
Held by 4 FIIs (3.28%)
Micro Age Instruments Pvt Ltd (20.52%)
Ashoka Investment Holdings Limited (3.28%)
26.68%
Quarterly Results Snapshot (Consolidated) - Mar'26 - QoQ

QoQ Growth in quarter ended Mar 2026 is 16.58% vs -2.37% in Dec 2025

QoQ Growth in quarter ended Mar 2026 is 35.00% vs 385.71% in Dec 2025
Half Yearly Results Snapshot (Consolidated) - Sep'25
Growth in half year ended Sep 2025 is -0.51% vs 8.82% in Sep 2024
Growth in half year ended Sep 2025 is -79.03% vs -11.30% in Sep 2024
Nine Monthly Results Snapshot (Consolidated) - Dec'25
YoY Growth in nine months ended Dec 2025 is 8.75% vs 0.66% in Dec 2024
YoY Growth in nine months ended Dec 2025 is -86.90% vs 44.28% in Dec 2024
Annual Results Snapshot (Consolidated) - Mar'26
YoY Growth in year ended Mar 2026 is 10.73% vs -1.02% in Mar 2025
YoY Growth in year ended Mar 2026 is -83.96% vs 27.38% in Mar 2025
About Kinetic Engineering Ltd

Company Coordinates


