
Compare Kingfa Science with Similar Stocks
Dashboard
Company has a Debt to Equity ratio (avg) of 0.04 times
Healthy long term growth as Net Sales has grown by an annual rate of 26.05% and Operating profit at 90.70%
Positive results in Mar 26
With ROE of 25.4, it has a Expensive valuation with a 9.7 Price to Book Value
Majority shareholders : Promoters
Market Beating performance in long term as well as near term
Stock DNA
Plastic Products - Industrial
INR 7,137 Cr (Small Cap)
38.00
35
0.00%
0.03
25.43%
9.76
Total Returns (Price + Dividend) 
Latest dividend: 10 per share ex-dividend date: Sep-17-2024
Risk Adjusted Returns v/s
Returns Beta

News

Kingfa Science & Technology Downgraded to Hold Amid Mixed Technical and Valuation Signals
Kingfa Science & Technology (India) Ltd, a notable player in the Plastic Products - Industrial sector, has seen its investment rating downgraded from Buy to Hold as of 1 June 2026. This adjustment reflects a nuanced shift across four key parameters: quality, valuation, financial trend, and technical indicators, signalling a more cautious stance despite the company’s strong long-term performance.
Read full news article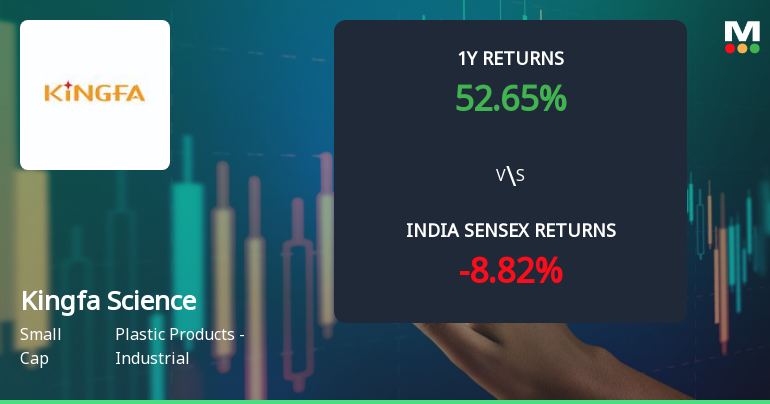
Kingfa Science & Technology (India) Ltd Sees Technical Momentum Shift Amid Mixed Indicator Signals
Kingfa Science & Technology (India) Ltd, a small-cap player in the Plastic Products - Industrial sector, has experienced a notable shift in its technical momentum, moving from a bullish to a mildly bullish stance. Despite a recent day decline of 2.85%, the stock’s technical indicators present a complex picture, with some signals pointing to strength while others suggest caution. This article analyses the latest technical parameters, price momentum, and relative performance against the Sensex to provide a comprehensive view for investors.
Read full news article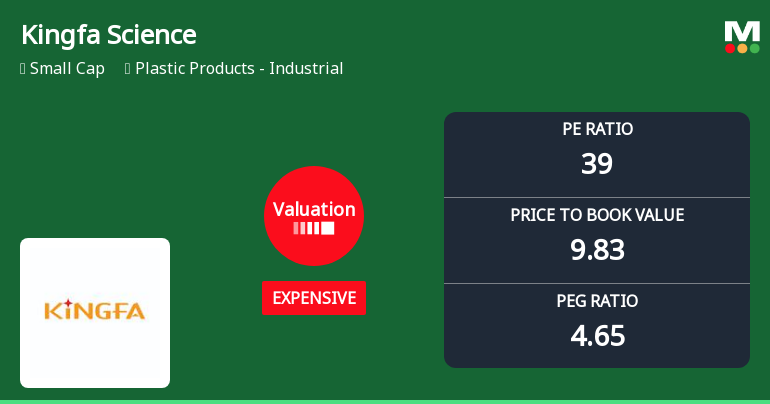
Kingfa Science & Technology Valuation Shifts Signal Changing Market Sentiment
Kingfa Science & Technology (India) Ltd has witnessed a notable shift in its valuation parameters, moving from a very expensive to an expensive rating. This change reflects evolving market perceptions amid strong operational metrics and a robust price performance that outpaces benchmark indices. Investors are now reassessing the stock’s price attractiveness in light of its elevated price-to-earnings and price-to-book ratios compared to historical and peer averages.
Read full news article Announcements
Announcement under Regulation 30 (LODR)-Newspaper Publication
30-May-2026 | Source : BSENewspaper Publication for Audited Financial Results of the Company for the Quarter and Financial Year ended March 31 2026
Results - Financial Results For March 31 2026
29-May-2026 | Source : BSEAudited Financial Results for period ended March 31 2026
Compliances-Reg.24(A)-Annual Secretarial Compliance
29-May-2026 | Source : BSEAnnual Secretarial Compliance Report for the Financial Year ending 31.03.2026
Corporate Actions

No Upcoming Board Meetings

Kingfa Science & Technology (India) Ltd has declared 100% dividend, ex-date: 17 Sep 24

No Splits history available

No Bonus history available

Kingfa Science & Technology (India) Ltd has announced 18:91 rights issue, ex-date: 09 Mar 17
Quality key factors
Valuation key factors
Technicals key factors
 Technical Indicator Scale: Bearish, Mildly Bearish, Sideways, Mildly Bullish, Bullish Turned
 Shareholding Snapshot : Mar 2026
Shareholding Compare (%holding)
Promoters
None
Held by 2 Schemes (6.66%)
Held by 10 FIIs (7.76%)
Kingfa Sci. And Tech. Co. Ltd (67.02%)
Sbi Mutual Fund (6.55%)
13.4%
Quarterly Results Snapshot (Standalone) - Mar'26 - QoQ

QoQ Growth in quarter ended Mar 2026 is 18.19% vs 5.10% in Dec 2025
QoQ Growth in quarter ended Mar 2026 is 30.95% vs 9.80% in Dec 2025
Half Yearly Results Snapshot (Standalone) - Sep'25

Growth in half year ended Sep 2025 is 11.12% vs 21.07% in Sep 2024
Growth in half year ended Sep 2025 is 6.03% vs 18.08% in Sep 2024
Nine Monthly Results Snapshot (Standalone) - Dec'25
YoY Growth in nine months ended Dec 2025 is 11.13% vs 17.71% in Dec 2024
YoY Growth in nine months ended Dec 2025 is 13.64% vs 24.72% in Dec 2024
Annual Results Snapshot (Standalone) - Mar'26
YoY Growth in year ended Mar 2026 is 14.38% vs 17.27% in Mar 2025
YoY Growth in year ended Mar 2026 is 21.20% vs 24.76% in Mar 2025
About Kingfa Science & Technology (India) Ltd

Company Coordinates


