
Compare Kiran Syntex with Similar Stocks
Dashboard
Weak Long Term Fundamental Strength with an average Return on Equity (ROE) of 0%
- Poor long term growth as Operating profit has grown by an annual rate 1.36% of over the last 5 years
- Company's ability to service its debt is weak with a poor EBIT to Interest (avg) ratio of -0.07
Flat results in Mar 26
With ROE of -3.6, it has a Very Expensive valuation with a 3.3 Price to Book Value
Stock DNA
Garments & Apparels
INR 7 Cr (Micro Cap)
NA (Loss Making)
23
0.00%
-0.08
-3.63%
3.50
Total Returns (Price + Dividend) 
Kiran Syntex for the last several years.
Risk Adjusted Returns v/s
Returns Beta

News

Kiran Syntex Ltd Downgraded to Sell by MarketsMOJO Amid Valuation and Quality Concerns
Kiran Syntex Ltd, a micro-cap player in the Garments & Apparels sector, has seen its investment rating downgraded to a Sell with a Mojo Score of 44.0 as of 3 June 2026. This shift reflects a complex interplay of factors across quality, valuation, financial trends, and technical indicators, signalling caution for investors despite the stock’s recent market outperformance.
Read full news article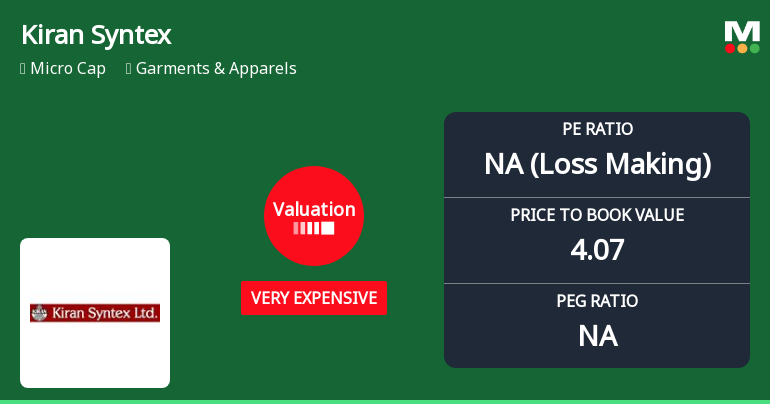
Kiran Syntex Ltd Valuation Shifts to Very Expensive Amid Strong Returns
Kiran Syntex Ltd, a micro-cap player in the Garments & Apparels sector, has undergone a significant valuation re-rating, moving from a risky to a very expensive valuation grade. Despite robust stock returns outperforming the Sensex over multiple timeframes, the sharp deterioration in key valuation parameters such as the price-to-earnings (P/E) ratio and price-to-book value (P/BV) raises concerns about price attractiveness and potential downside risk for investors.
Read full news article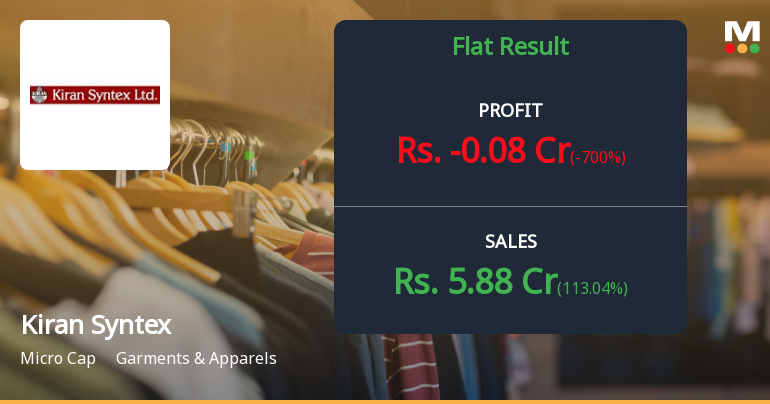
Kiran Syntex Q4 FY26: Revenue Surge Masks Profitability Crisis as Losses Deepen
Kiran Syntex Limited, a micro-cap polyester dyed yarn manufacturer based in Surat, reported a dramatic revenue revival in Q4 FY26 (March quarter) with net sales surging 591.76% year-on-year to ₹5.88 crores. However, the company's profitability remains deeply troubled, posting a net loss of ₹0.08 crores despite the revenue bounce-back. With a market capitalisation of just ₹8.00 crores and trading at ₹18.48, the stock has declined 0.11% following the results announcement, reflecting investor scepticism about the sustainability of this turnaround.
Read full news article Announcements
Announcement under Regulation 30 (LODR)-Newspaper Publication
01-Jun-2026 | Source : BSESubmission of Newspaper Advertisement for Publication of Audited Financial Statements for Quarter and Year Ended 31st March 2026
Financial Results For Period Ended 31/03/2026
30-May-2026 | Source : BSESubmission of Financial Results for Period ended 31/03/2026
Board Meeting Outcome for Outcome Of Board Meeting
30-May-2026 | Source : BSESubmission of Outcome of Board Meeting
Corporate Actions

No Upcoming Board Meetings

No Dividend history available

No Splits history available

No Bonus history available

No Rights history available
Quality key factors
Valuation key factors
Technicals key factors
 Technical Indicator Scale: Bearish, Mildly Bearish, Sideways, Mildly Bullish, Bullish Turned
 Shareholding Snapshot : Dec 2025
Shareholding Compare (%holding)
Non Institution
None
Held by 4 Schemes (0.22%)
Held by 0 FIIs
Ami Jigar Godiwala (14.3%)
Astor Stock Brokers Private Limited (2.82%)
46.29%
Quarterly Results Snapshot (Standalone) - Mar'26 - QoQ

QoQ Growth in quarter ended Mar 2026 is 113.04% vs -30.13% in Dec 2025

QoQ Growth in quarter ended Mar 2026 is -700.00% vs -125.00% in Dec 2025
Half Yearly Results Snapshot (Standalone) - Sep'25
Growth in half year ended Sep 2025 is 0.00% vs 0.00% in Sep 2024
Growth in half year ended Sep 2025 is 133.33% vs 14.29% in Sep 2024
Nine Monthly Results Snapshot (Standalone) - Dec'25
YoY Growth in nine months ended Dec 2025 is 0.00% vs 0.00% in Dec 2024
YoY Growth in nine months ended Dec 2025 is 114.29% vs 12.50% in Dec 2024
Annual Results Snapshot (Standalone) - Mar'26
YoY Growth in year ended Mar 2026 is 1,651.76% vs 0.00% in Mar 2025
YoY Growth in year ended Mar 2026 is 12.50% vs 11.11% in Mar 2025
About Kiran Syntex Ltd

Company Coordinates


