
Compare Kirl. Ferrous with Similar Stocks
Dashboard
Strong ability to service debt as the company has a low Debt to EBITDA ratio of 1.23 times
Poor long term growth as Operating profit has grown by an annual rate -4.65% of over the last 5 years
Positive results in Mar 26
With ROCE of 12, it has a Very Attractive valuation with a 1.8 Enterprise value to Capital Employed
Increasing Participation by Institutional Investors
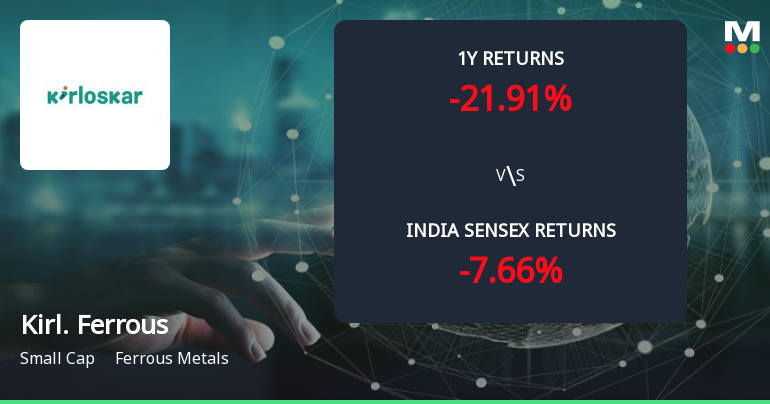
Underperformed the market in the last 1 year
Stock DNA
Ferrous Metals
INR 7,646 Cr (Small Cap)
21.00
24
1.29%
0.24
9.65%
1.99
Total Returns (Price + Dividend) 
Latest dividend: 3.006697140427341 per share ex-dividend date: Jul-17-2026
Risk Adjusted Returns v/s
Returns Beta

News
Golden Cross Forms in Kirloskar Ferrous Industries Ltd — On a Day the Stock Fell 1.37%. What the Mixed Signals Mean
The 50-day moving average has crossed above the 200-day moving average for Kirloskar Ferrous Industries Ltd, signalling a golden cross on 23 Jul 2026. Yet, the stock declined 1.37% on the same day, while monthly technical indicators remain bearish. This divergence between the moving averages and price action calls for a detailed examination of the signal’s reliability.
Read full news article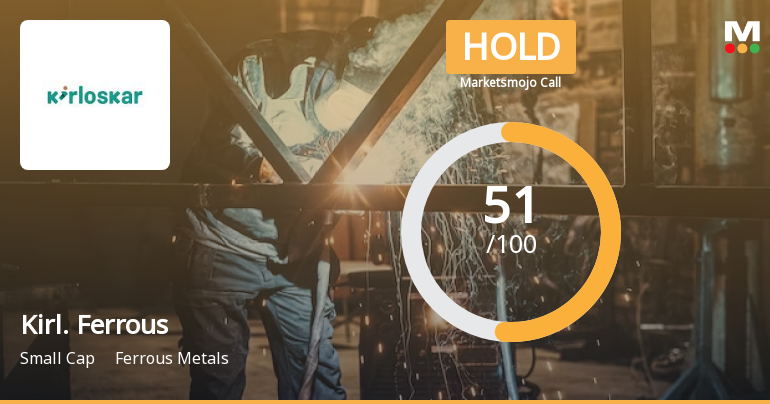
Kirloskar Ferrous Industries Ltd is Rated Hold
Kirloskar Ferrous Industries Ltd is rated 'Hold' by MarketsMOJO, with this rating last updated on 30 June 2026. However, the analysis and financial metrics discussed here reflect the stock's current position as of 23 July 2026, providing investors with an up-to-date perspective on the company’s fundamentals, valuation, financial trends, and technical outlook.
Read full news article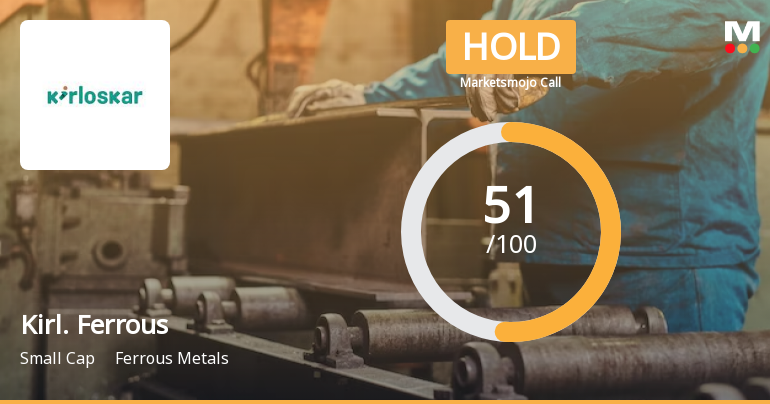
Kirloskar Ferrous Industries Ltd is Rated Hold
Kirloskar Ferrous Industries Ltd is rated 'Hold' by MarketsMOJO, with this rating last updated on 30 June 2026. However, the analysis and financial metrics discussed here reflect the stock's current position as of 12 July 2026, providing investors with the latest insights into its performance and outlook.
Read full news article Announcements
Compliances-Certificate under Reg. 74 (5) of SEBI (DP) Regulations 2018
16-Jul-2026 | Source : BSECertificate pursuant to Regulation 74(5) of the SEBI (Depositories and Participants) Regulations 2018
Announcement under Regulation 30 (LODR)-Newspaper Publication
14-Jul-2026 | Source : BSENotice to the Members published in the newspapers
Reg. 34 (1) Annual Report.
13-Jul-2026 | Source : BSEAnnual Report and Notice of Annual General Meeting
Corporate Actions

No Upcoming Board Meetings

Kirloskar Ferrous Industries Ltd has declared 60% dividend, ex-date: 17 Jul 26

No Splits history available

No Bonus history available

Kirloskar Ferrous Industries Ltd has announced 9:10 rights issue, ex-date: 19 Dec 06
Quality key factors
Valuation key factors
Technicals key factors
 Technical Indicator Scale: Bearish, Mildly Bearish, Sideways, Mildly Bullish, Bullish Turned
 Shareholding Snapshot : Mar 2026
Shareholding Compare (%holding)
Promoters
None
Held by 14 Schemes (11.99%)
Held by 86 FIIs (1.78%)
Kirloskar Industries Limited (45.93%)
Hdfc Small Cap Fund (4.79%)
20.11%
Quarterly Results Snapshot (Consolidated) - Mar'26 - QoQ

QoQ Growth in quarter ended Mar 2026 is 12.31% vs -7.82% in Dec 2025
QoQ Growth in quarter ended Mar 2026 is 128.34% vs -36.21% in Dec 2025
Half Yearly Results Snapshot (Consolidated) - Sep'25
Growth in half year ended Sep 2025 is 7.26% vs 5.14% in Sep 2024
Growth in half year ended Sep 2025 is 23.08% vs -15.59% in Sep 2024
Nine Monthly Results Snapshot (Consolidated) - Dec'25
YoY Growth in nine months ended Dec 2025 is 5.06% vs 4.70% in Dec 2024
YoY Growth in nine months ended Dec 2025 is 17.23% vs -27.95% in Dec 2024
Annual Results Snapshot (Consolidated) - Mar'26

YoY Growth in year ended Mar 2026 is 4.94% vs 6.80% in Mar 2025
YoY Growth in year ended Mar 2026 is 72.51% vs -1.26% in Mar 2025
About Kirloskar Ferrous Industries Ltd

Company Coordinates


