
Compare Kirloskar Indus. with Similar Stocks
Dashboard
Strong ability to service debt as the company has a low Debt to EBITDA ratio of 1.31 times
- PAT(Latest six months) At Rs 76.36 cr has Grown at 22.34%
- OPERATING PROFIT TO INTEREST(Q) Highest at 7.16 times
- DEBT-EQUITY RATIO(HY) Lowest at 0.18 times
With ROCE of 8.2, it has a Very Attractive valuation with a 0.6 Enterprise value to Capital Employed
Despite the size of the company, domestic mutual funds hold only 0% of the company
Underperformed the market in the last 1 year
Stock DNA
Other Industrial Products
INR 3,581 Cr (Small Cap)
20.00
87
0.37%
0.17
2.22%
0.54
Total Returns (Price + Dividend) 
Latest dividend: 13 per share ex-dividend date: Aug-06-2025
Risk Adjusted Returns v/s
Returns Beta

News
Are Kirloskar Industries Ltd latest results good or bad?
Kirloskar Industries Ltd's latest financial results for the quarter ending March 2026 reflect a complex operational landscape. The company reported consolidated net profit of ₹43.10 crore, which represents a significant sequential improvement of 111.90% compared to the previous quarter, where profits had declined sharply. However, on a year-on-year basis, net profit showed a decline of 7.91%, indicating ongoing challenges in profitability despite revenue growth. Net sales for the same quarter reached ₹1,827.41 crore, marking a sequential increase of 12.53% and a year-on-year growth of 4.55%. This growth in sales is attributed to a recovery in demand across Kirloskar's industrial products portfolio, achieving the highest quarterly revenue in the company's recent history. However, the translation of this top-line growth into bottom-line performance remains a concern, as profitability growth has not kept pace...
Read full news article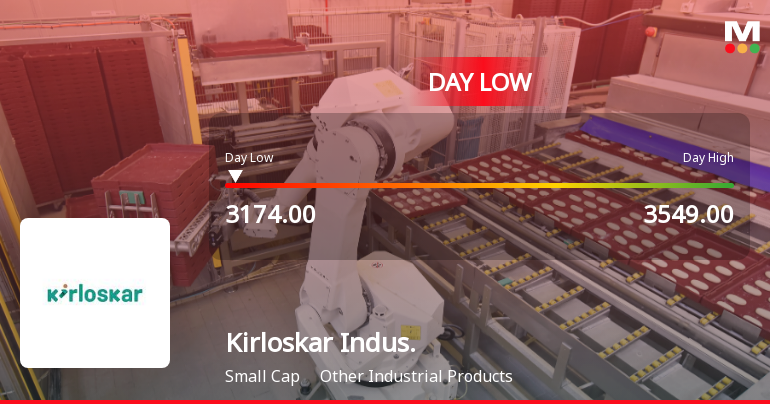
Kirloskar Industries Ltd Hits Intraday Low Amid Price Pressure on 20 May 2026
Kirloskar Industries Ltd experienced a notable intraday decline on 20 May 2026, with the stock touching a low of Rs 3,180.5, marking a 7.65% drop from its previous close. This downturn occurred despite a broadly positive market environment, reflecting specific pressures on the stock within the Other Industrial Products sector.
Read full news article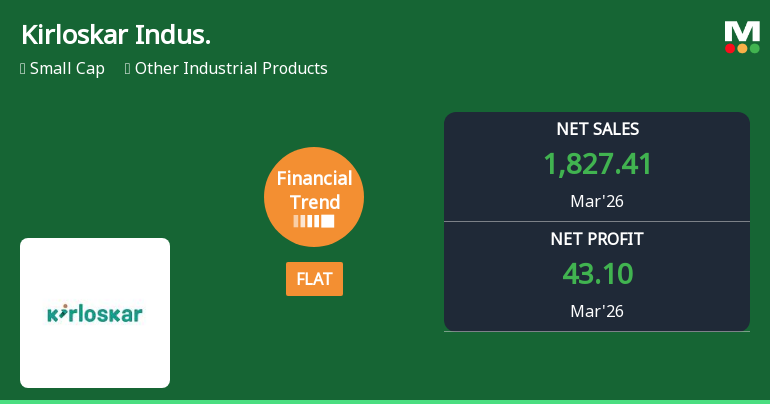
Kirloskar Industries Ltd Reports Flat Quarterly Performance Amid Strong Revenue and Profit Growth
Kirloskar Industries Ltd, a small-cap player in the Other Industrial Products sector, has reported a flat financial performance for the quarter ended March 2026, signalling a stabilisation after a period of negative trends. Despite the flat quarter, the company demonstrated robust revenue growth and improved profitability metrics, reflecting a cautious but positive shift in its financial trajectory.
Read full news article Announcements
Audited Financial Results For The Quarter And Year Ended 31 March 2026
19-May-2026 | Source : BSEDear Sir / Madam Please find enclosed the Standalone and Consolidated Audited Financial Results for the quarter and Year ended 31 March 2026.
Board Meeting Outcome for Outcome Of The Board Meeting
19-May-2026 | Source : BSEDear Sir / Madam Please find enclosed the Outcome of the Board Meeting held on 19 May 2026. You are requested to take the same on your record
Announcement under Regulation 30 (LODR)-Dividend Updates
19-May-2026 | Source : BSEDear Sir /Madam Please find enclosed the intimation related to Dividend . You are requested to take the same on your record.
Corporate Actions

No Upcoming Board Meetings

Kirloskar Industries Ltd has declared 130% dividend, ex-date: 06 Aug 25

No Splits history available

Kirloskar Industries Ltd has announced 1:1 bonus issue, ex-date: 25 Oct 07

No Rights history available
Quality key factors
Valuation key factors
Technicals key factors
 Technical Indicator Scale: Bearish, Mildly Bearish, Sideways, Mildly Bullish, Bullish Turned
 Shareholding Snapshot : Mar 2026
Shareholding Compare (%holding)
Promoters
None
Held by 3 Schemes (0.0%)
Held by 43 FIIs (0.5%)
Rahul Chandrakant Kirloskar (17.6%)
Mahesh Ramchand Chhabria (1.93%)
19.52%
Quarterly Results Snapshot (Consolidated) - Mar'26 - QoQ

QoQ Growth in quarter ended Mar 2026 is 12.53% vs -8.87% in Dec 2025
QoQ Growth in quarter ended Mar 2026 is 111.90% vs -60.60% in Dec 2025
Half Yearly Results Snapshot (Consolidated) - Sep'25
Growth in half year ended Sep 2025 is 7.41% vs 5.20% in Sep 2024
Growth in half year ended Sep 2025 is 22.02% vs -49.91% in Sep 2024
Nine Monthly Results Snapshot (Consolidated) - Dec'25
YoY Growth in nine months ended Dec 2025 is 5.17% vs 4.75% in Dec 2024
YoY Growth in nine months ended Dec 2025 is 13.23% vs -50.52% in Dec 2024
Annual Results Snapshot (Consolidated) - Mar'26
YoY Growth in year ended Mar 2026 is 5.00% vs 3.76% in Mar 2025
YoY Growth in year ended Mar 2026 is 6.59% vs -25.60% in Mar 2025
About Kirloskar Industries Ltd

Company Coordinates


