
Compare KJMC Financial with Similar Stocks
Stock DNA
Non Banking Financial Company (NBFC)
INR 26 Cr (Micro Cap)
15.00
20
0.00%
0.13
1.65%
0.24
Total Returns (Price + Dividend) 
KJMC Financial for the last several years.
Risk Adjusted Returns v/s
Returns Beta

News

KJMC Financial Services Ltd Upgraded to Sell on Valuation Improvement and Technical Signals
KJMC Financial Services Ltd has seen its investment rating upgraded from Strong Sell to Sell, driven primarily by a marked improvement in valuation metrics despite flat quarterly financial performance and weak long-term fundamentals. The micro-cap NBFC’s recent re-assessment reflects a nuanced balance between attractive pricing and ongoing operational challenges.
Read full news articleAre KJMC Financial Services Ltd latest results good or bad?
KJMC Financial Services Ltd's latest financial results for the quarter ending March 2026 indicate significant operational challenges. The company reported a net profit of -₹0.28 crores, reflecting a substantial decline compared to the previous quarter's profit of ₹0.22 crores. This marks a notable deterioration in profitability, as evidenced by a profit after tax margin that fell sharply to -29.89% from 13.75% in the preceding quarter. Revenue for the quarter also faced severe pressure, declining by 45.63% quarter-on-quarter to ₹0.87 crores, which is the lowest revenue figure since March 2025. While there was a remarkable year-on-year revenue increase of 1,640.00% from a very low base, the sequential decline highlights acute operational stress. The operating profit margin, excluding other income, decreased to 22.99%, down from 55.63% in the prior quarter, indicating a contraction in core business performan...
Read full news article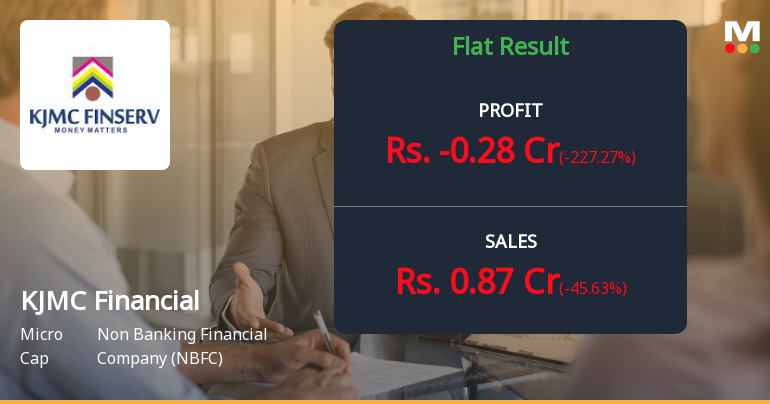
KJMC Financial Services Q4 FY26: Sharp Profit Decline Signals Operational Distress
KJMC Financial Services Ltd., a Mumbai-based non-banking financial company (NBFC), reported a consolidated net loss of ₹0.28 crores for Q4 FY26 (January-March 2026), marking a dramatic reversal from the ₹0.22 crore profit posted in Q3 FY26. The quarter-on-quarter deterioration of 227.27% and year-on-year decline of 41.67% underscore mounting operational challenges at the micro-cap financial services provider. With a market capitalisation of just ₹28.00 crores and the stock trading at ₹56.00 as of June 01, 2026, KJMC's shares have plunged 41.24% over the past year, significantly underperforming the broader NBFC sector's 3.47% gain.
Read full news article Announcements
Announcement under Regulation 30 (LODR)-Newspaper Publication
31-May-2026 | Source : BSENewspaper Publication of Audited Standalone and Consolidated Financial Results for the Quarter and Year Ended March 31 2026.
Board Meeting Outcome for Board Meeting Outcome For Board Meeting Held On May 29 2026
29-May-2026 | Source : BSE1. Considered and approved Audited Financial Results(Standalone and Consolidated) for the Financial Year ended March 31 2026 along with Auditors Report. 2. Recommended dividend of Rs.1.00/- per Equity Share of Face value of Rs.10/- each subject to approval of members of the ensuing Annual General Meeting. 3. Appointment of M/s L K J & Associates LLP (formerly known as R V Luharka & Co. LLP as an Internal Auditor of the Company for the Financial Year 2026-27.
Corporate Action-Board approves Dividend
29-May-2026 | Source : BSERecommended Final Dividend of Rs. 1.00/- per Equity Shares of Face Value of Rs. 10/- each subject to the approval of Members at the ensuing Annual General Meeting.
Corporate Actions

No Upcoming Board Meetings

No Dividend history available

No Splits history available

No Bonus history available

No Rights history available
Quality key factors
Valuation key factors
Technicals key factors
 Technical Indicator Scale: Bearish, Mildly Bearish, Sideways, Mildly Bullish, Bullish Turned
 Shareholding Snapshot : Mar 2026
Shareholding Compare (%holding)
Promoters
None
Held by 0 Schemes
Held by 0 FIIs
Chanddevi Jain (43.53%)
Tck Finance & Leasing Private Limited (1.57%)
17.69%
Quarterly Results Snapshot (Consolidated) - Mar'26 - QoQ

QoQ Growth in quarter ended Mar 2026 is -45.63% vs -13.51% in Dec 2025
QoQ Growth in quarter ended Mar 2026 is -227.27% vs -66.67% in Dec 2025
Half Yearly Results Snapshot (Consolidated) - Sep'25
Growth in half year ended Sep 2025 is 2.77% vs 52.32% in Sep 2024
Growth in half year ended Sep 2025 is 32.82% vs 114.75% in Sep 2024
Nine Monthly Results Snapshot (Consolidated) - Dec'25
YoY Growth in nine months ended Dec 2025 is 8.81% vs 41.45% in Dec 2024
YoY Growth in nine months ended Dec 2025 is 46.27% vs 59.52% in Dec 2024
Annual Results Snapshot (Consolidated) - Mar'26

YoY Growth in year ended Mar 2026 is 32.11% vs 6.26% in Mar 2025
YoY Growth in year ended Mar 2026 is 101.18% vs -1.16% in Mar 2025
About KJMC Financial Services Ltd

Company Coordinates


