KMC Speciality

  • Market Cap: Micro Cap
  • Industry: Hospital
  • ISIN: INE879K01018
  • NSEID:
  • BSEID: 524520
INR
100.52
3.75 (3.88%)
BSENSE

May 29

BSE+NSE Vol: 7.71 lacs

  • Price Points
  • Score
  • Mojo Parameters
  • Total Return
  • News and Corporate Actions
  • Key factors
  • Shareholding
  • Financials
  • CompanyCV
stock-summaryPrice Point
High/Low

1Day

52 Week

Valuation
Technical
Day's Volume

CASH

7.71 lacs (235.63%) Volume

Shareholding (Mar 2026)

FII

0.00%

Held by 1 FIIs

DII

0.00%

Held by 0 DIIs

Promoter

75.00%

how big is KMC Speciality?

06-Jun-2025

As of Jun 06, KMC Speciality Hospitals (India) Ltd has a market capitalization of 1,102.00 Cr, with recent net sales of 231.59 Cr and a net profit of 21.42 Cr for the latest four quarters.

Market Cap: <BR>As of Jun 06, KMC Speciality Hospitals (India) Ltd has a market capitalization of 1,102.00 Cr, categorizing it as a Small Cap company.<BR><BR>Recent Quarterly Performance: <BR>For the latest 4 quarters, KMC Speciality reported Net Sales of 231.59 Cr and a Net Profit of 21.42 Cr. This data is based on Standalone financials.<BR><BR>Balance Sheet Snapshot: <BR>The Standalone balance sheet for the latest annual period ending in Mar'24 shows Shareholder's Funds of 143.58 Cr and Total Assets of 263.72 Cr.

View full answer

Who are in the management team of KMC Speciality?

06-Jun-2025

As of March 2023, the management team of KMC Speciality includes S Chandrakumar (Executive Chairman), Selvaraj Manivannan (Managing Director), and several non-executive directors, ensuring a diverse governance structure. Other key members include Sushma K (Company Secretary) and S Vijayabaskaran (Non-Executive Director).

As of March 2023, the management team of KMC Speciality includes the following individuals:<BR><BR>1. S Chandrakumar - Executive Chairman & Whole Time Director<BR>2. Selvaraj Manivannan - Managing Director<BR>3. A Krishnamoorthy - Non-Executive & Independent Director<BR>4. S Chenthilkumar - Non-Executive & Independent Director<BR>5. N Bala Baskar - Non-Executive & Independent Director<BR>6. N Jeyanthei - Non-Executive & Independent Director<BR>7. T Senthil Kumar - Non-Executive & Non-Independent Director<BR>8. Sushma K - Company Secretary & Compliance Officer<BR>9. S Vijayabaskaran - Non-Executive Director<BR><BR>This team comprises a mix of executive and non-executive members, ensuring a diverse governance structure.

View full answer

What does KMC Speciality do?

06-Jun-2025

KMC Speciality Hospitals (India) Ltd is a small-cap company in the hospital industry, reporting net sales of 61 Cr and a net profit of 5 Cr for March 2025. The company has a market cap of Rs 1,090 Cr and key metrics include a P/E ratio of 51.00 and a debt-equity ratio of 0.49.

Overview:<BR>KMC Speciality Hospitals (India) Ltd operates in the hospital industry and is categorized as a small-cap company.<BR><BR>History:<BR>The company was originally incorporated as 'Advanced Medical Care Private Limited' in 1982, converted to a Public Limited Company in 1988, and underwent name changes to 'Seahorse Hospitals Limited' in 1995 and to its current name in 2008. The latest quarterly results reported net sales and net profit for March 2025.<BR><BR>Financial Snapshot:<BR>- Net Sales: 61 Cr (Quarterly Results - Mar 2025)<BR>- Net Profit: 5 Cr (Quarterly Results - Mar 2025)<BR>- Market Cap: Rs 1,090 Cr (Small Cap)<BR><BR>Key Metrics:<BR>- P/E: 51.00<BR>- Industry P/E: 54<BR>- Dividend Yield: 0.00%<BR>- Debt-Equity: 0.49<BR>- Return on Equity: 13.03%<BR>- Price to Book: 6.68<BR><BR>Contact Details:<BR>Address: 6 Royal Road, Cantonment Trichy Tamil Nadu : 620001 <BR>Tel: 91-431-4077777 <BR>Email: cs.kmcshil@kauveryhospital.com <BR>Website: http://www.kmcspecialityhospital.in

View full answer

Has KMC Speciality declared dividend?

06-Jun-2025

No Dividend History Available

Who are the peers of the KMC Speciality?

03-Jun-2025

KMC Speciality's peers include Max Healthcare, Apollo Hospitals, Fortis Health, Narayana Hrudaya, Global Health, Asarfi Hospital, Aashka Hospitals, Chandan Healthcare, and Aprameya Enginee. KMC Speciality has average management risk, below average growth, and an excellent capital structure, but its 1-year return is the lowest among peers at -17.65%.

Peers: The peers of KMC Speciality are Max Healthcare, Apollo Hospitals, Fortis Health., Narayana Hrudaya, Global Health, Asarfi Hospital, Aashka Hospitals, Chandan Healthca, and Aprameya Enginee.<BR><BR>Quality Snapshot: Excellent management risk is observed at Max Healthcare, Narayana Hrudaya, Global Health, and Asarfi Hospital, while Good management risk is found at Apollo Hospitals, Fortis Health., and Chandan Healthca. Average management risk is associated with KMC Speciality and Aprameya Enginee, while Below Average management risk is noted at Aashka Hospitals. In terms of Growth, Excellent growth is seen at Max Healthcare, Apollo Hospitals, Chandan Healthca, and Aprameya Enginee, while Good growth is noted at Fortis Health. and Narayana Hrudaya. KMC Speciality and Asarfi Hospital exhibit Below Average growth, while Aashka Hospitals shows Below Average growth. Excellent capital structure is found at Max Healthcare, Global Health, and KMC Speciality, while Good capital structure is noted at Fortis Health., Narayana Hrudaya, Asarfi Hospital, and Chandan Healthca. Average capital structure is observed at Apollo Hospitals and Aprameya Enginee, while Below Average capital structure is seen at Aashka Hospitals.<BR><BR>Return Snapshot: Asarfi Hospital has the highest 1-year return at 110.53%, while KMC Speciality has the lowest at -17.65%. KMC Speciality's 1-year return is significantly lower than all its peers. Additionally, Global Health and KMC Speciality have negative six-month returns.

View full answer

Who are the top shareholders of the KMC Speciality?

17-Jul-2025

The top shareholder of KMC Speciality is Sri Kauvery Medical Care (India) Limited, holding 75%. D Chitra is the largest individual investor with 1.36%, while individual investors collectively own 22.03% of the shares.

The top shareholders of KMC Speciality are primarily the promoters, with Sri Kauvery Medical Care (India) Limited holding the largest stake at 75%. In terms of public shareholders, D Chitra is the highest individual investor with a holding of 1.36%. Additionally, individual investors collectively hold 22.03% of the shares. There are also four mutual fund schemes and one foreign institutional investor (FII) involved, but their holdings are minimal.

View full answer

How has been the historical performance of KMC Speciality?

13-Nov-2025

KMC Speciality has shown steady growth in net sales and total operating income, reaching 231.60 Cr in March 2025, but faced declines in profit metrics and increased liabilities, indicating potential profitability challenges. Cash flow from operations improved, contributing to a stronger cash position despite negative investing cash flow.

Answer:<BR>The historical performance of KMC Speciality shows a steady growth in net sales, reaching 231.60 Cr in March 2025, up from 177.18 Cr in March 2024 and 155.76 Cr in March 2023. Total operating income has followed a similar upward trend, increasing to 231.60 Cr in March 2025 from 177.18 Cr in the previous year. The company's total expenditure, excluding depreciation, also rose to 174.71 Cr in March 2025, compared to 129.79 Cr in March 2024. Operating profit, excluding other income, improved to 56.89 Cr in March 2025, while profit before tax decreased to 31.60 Cr from 40.56 Cr in March 2024. Profit after tax also saw a decline to 21.43 Cr in March 2025 from 30.38 Cr in March 2024. The earnings per share (EPS) decreased to 1.31 in March 2025 from 1.86 in March 2024. <BR><BR>In terms of assets and liabilities, total assets increased to 286.00 Cr in March 2025 from 263.72 Cr in March 2024, while total liabilities also rose to 286.00 Cr from 263.72 Cr. The company's long-term borrowings increased to 72.33 Cr in March 2025, up from 63.85 Cr in March 2024. Cash flow from operating activities improved to 57.00 Cr in March 2025, compared to 38.00 Cr in March 2024, while cash flow from investing activities showed a negative trend at -50.00 Cr in March 2025. The closing cash and cash equivalents increased to 9.00 Cr in March 2025 from 4.00 Cr in March 2024, indicating a positive cash position despite the fluctuations in profit metrics.<BR><BR>Breakdown:<BR>KMC Speciality has demonstrated consistent growth in net sales, which rose from 102.64 Cr in March 2021 to 231.60 Cr in March 2025. This growth is reflected in the total operating income, which also increased significantly over the years. However, the total expenditure has risen in tandem, leading to an operating profit of 56.89 Cr in March 2025, a notable increase from previous years. Despite this, profit before tax and profit after tax saw declines in March 2025 compared to the previous year, indicating potential challenges in maintaining profitability. The company's total assets and liabilities have both increased, with long-term borrowings rising significantly, suggesting increased leverage. Cash flow from operating activities has improved, contributing to a stronger cash position, even as cash flow from investing activities remains negative. Overall, while KMC Speciality has shown growth in sales and operating income, profitability metrics and rising liabilities warrant close attention.

View full answer

Is KMC Speciality overvalued or undervalued?

14-Nov-2025

As of November 13, 2025, KMC Speciality is considered undervalued with a PE Ratio of 41.88 and an attractive valuation compared to peers like Apollo Hospitals and Max Healthcare, while also outperforming the Sensex with a 1-week return of 12.88%.

As of 13 November 2025, KMC Speciality has moved from a fair to an attractive valuation grade. The company is currently considered undervalued, especially when compared to its peers in the hospital industry. Key ratios include a PE Ratio of 41.88, an EV to EBITDA of 19.70, and a ROE of 18.51%. <BR><BR>In comparison to peers, Apollo Hospitals has a significantly higher PE Ratio of 64.07, while Max Healthcare is even more expensive at 88.67. This suggests that KMC Speciality offers a more favorable valuation relative to its competitors. Additionally, KMC's recent stock performance has outpaced the Sensex, with a 1-week return of 12.88% compared to the Sensex's 1.40%, reinforcing the attractiveness of its current valuation.

View full answer

Is KMC Speciality technically bullish or bearish?

24-Nov-2025

As of November 21, 2025, the trend is mildly bullish due to daily moving averages, but mixed signals from weekly and monthly indicators suggest underlying weaknesses.

As of 21 November 2025, the technical trend has changed from bullish to mildly bullish. The current stance is mildly bullish, driven primarily by the daily moving averages indicating bullish momentum. However, the weekly MACD and KST are bullish, while the monthly MACD and KST are bearish, suggesting mixed signals across different time frames. The weekly RSI is bearish, which adds to the cautious outlook. Overall, the indicators reflect a mildly bullish sentiment, but with some underlying weaknesses, particularly in the longer-term monthly data.

View full answer

Are KMC Speciality Hospitals (India) Ltd latest results good or bad?

11-Feb-2026

KMC Speciality Hospitals (India) Ltd reported strong Q3 FY26 results, with a net profit of ₹13.73 crore, up 26.67% quarter-on-quarter and 82.83% year-on-year, alongside a revenue increase to ₹82.06 crore. Overall, the results indicate a positive performance and strong market confidence in the company's growth.

KMC Speciality Hospitals (India) Ltd has reported strong results for Q3 FY26, indicating a positive performance. The company achieved a net profit of ₹13.73 crore, which reflects a significant increase of 26.67% quarter-on-quarter and an impressive 82.83% year-on-year growth. Revenue also saw a healthy rise, reaching ₹82.06 crore, up 9.56% from the previous quarter and 33.74% compared to the same quarter last year.<BR><BR>Additionally, the operating margin improved to 30.17%, marking a substantial increase of 235 basis points from the previous quarter and 408 basis points year-on-year. The profit after tax (PAT) margin also expanded to 16.73%, the highest in the company's recent history.<BR><BR>Overall, these results demonstrate a remarkable turnaround for KMC Speciality, showcasing strong operational momentum and improved efficiency. The stock has responded positively, gaining 11.83% over the past week, which reflects market confidence in the company's growth trajectory. Thus, the latest results can be considered very good for KMC Speciality Hospitals.

View full answer

When is the next results date for KMC Speciality Hospitals (India) Ltd?

26-May-2026

The next results date for KMC Speciality Hospitals (India) Ltd is 29 May 2026.

The next results date for KMC Speciality Hospitals (India) Ltd is scheduled for 29 May 2026.

View full answer

Why is KMC Speciality Hospitals (India) Ltd falling/rising?

29-May-2026

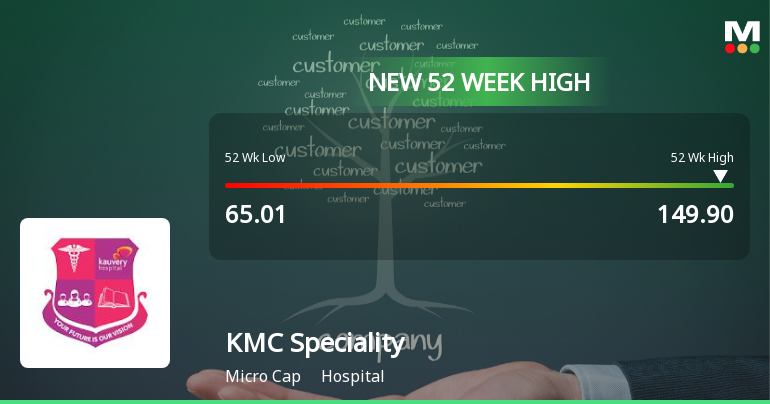
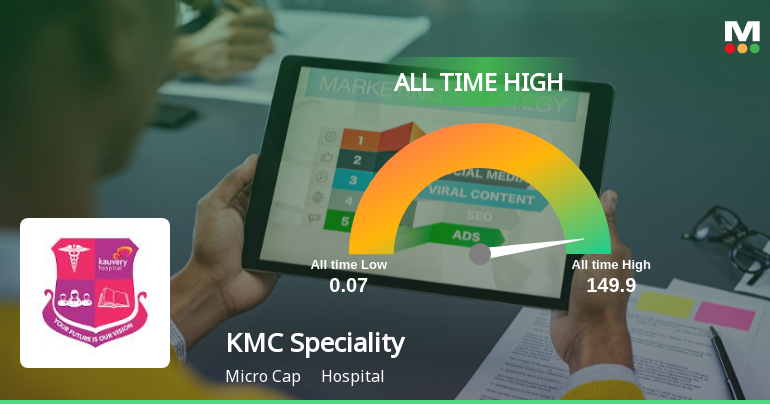
As of 29-May, KMC Speciality Hospitals (India) Ltd's stock price has risen to Rs. 100.52, reflecting a 3.88% increase. The stock has reached a new 52-week high, outperformed the sector, and shown significant gains over various time frames, indicating strong investor confidence and positive market performance.

As of 29-May, KMC Speciality Hospitals (India) Ltd is experiencing a rise in its stock price, currently at Rs. 100.52, which reflects an increase of Rs. 3.75 or 3.88%. This upward movement is supported by several key factors. The stock has recently hit a new 52-week high of Rs. 103.9, indicating strong performance. Additionally, it has outperformed the sector by 5.65% today and has shown consecutive gains over the past two days, with a total return of 5.46% during this period.<BR><BR>The stock's performance over various time frames also highlights its strength, with a year-to-date increase of 32.77% compared to a decline of 12.26% in the benchmark Sensex. Over the past year, KMC Speciality Hospitals has risen by 43.60%, while the Sensex has fallen by 8.40%. Furthermore, the stock is trading above its 5-day, 20-day, 50-day, 100-day, and 200-day moving averages, which is a positive technical indicator.<BR><BR>Investor participation has also increased, as evidenced by a delivery volume of 83.27k on 27 May, which is up by 52.8% compared to the 5-day average. This suggests growing interest and confidence among investors. Overall, these factors contribute to the rising trend in KMC Speciality Hospitals' stock price.

View full answer

Should I buy, sell or hold KMC Speciality Hospitals (India) Ltd?

30-May-2026
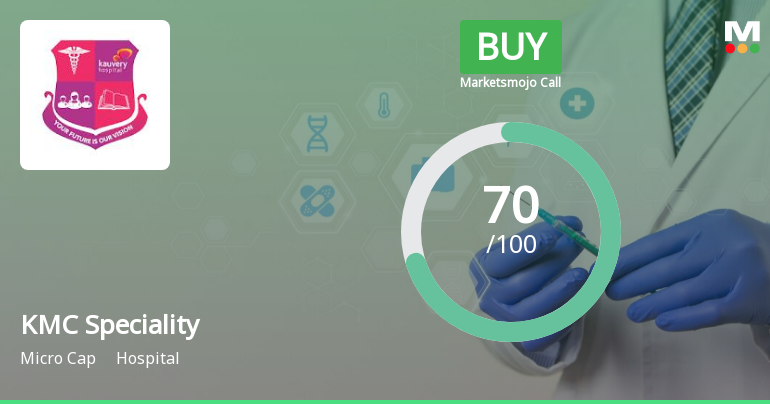
iScoreScore
Click here to find our call on this stock
Strong Sell
Sell
Hold
Buy
Strong Buy

Dashboard

1

Strong ability to service debt as the company has a low Debt to EBITDA ratio of 1.25 times

 
2

Healthy long term growth as Operating profit has grown by an annual rate 32.44%

 
3

With a growth in Operating Profit of 7.34%, the company declared Very Positive results in Mar 26

4

With ROCE of 20.3, it has a Fair valuation with a 7.1 Enterprise value to Capital Employed

5

Market Beating performance in long term as well as near term

stock-summaryMojo Parameters

Mojo Parameters

Loading Valuation Snapshot...

Stock DNA

stock-summary
Industry

Hospital

stock-summary
Market cap

INR 1,614 Cr (Micro Cap)

stock-summary
P/E

45.00

stock-summary
Industry P/E

61

stock-summary
Dividend Yield

0.00%

stock-summary
Debt Equity

0.31

stock-summary
Return on Equity

20.10%

stock-summary
Price to Book

8.66

Revenue and Profits:
Net Sales:
82 Cr
(Quarterly Results - Mar 2026)
Net Profit:
15 Cr
stock-summaryTotal Returns
Total Returns (Price + Dividend) stock-summary
Dividend Yield (0%)
TimePeriod
Price Return
Dividend Return
Total Return
3 Months
17.32%
0%
17.32%
6 Months
29.8%
0%
29.8%
1 Year
43.6%
0%
43.6%
2 Years
17.16%
0%
17.16%
3 Years
62.5%
0%
62.5%
4 Years
70.52%
0%
70.52%
5 Years
153.2%
0%
153.2%

KMC Speciality for the last several years.

Risk Adjusted Returns v/s stock-summary
Returns Beta
Icon
Beta has not been calculated since enough price history is not available
stock-summaryNews & Corporate Actions

Announcements stock-summary

Board Meeting Intimation for Board Meeting Scheduled To Be Held On 29Th May 2026

25-May-2026 | Source : BSE

KMC Speciality Hospitals (India) Ltdhas informed BSE that the meeting of the Board of Directors of the Company is scheduled on 29/05/2026 inter alia to consider and approve The Audited financial results of the Company for the quarter and financial year ended 31st March 2026

Announcement under Regulation 30 (LODR)-Newspaper Publication

20-Apr-2026 | Source : BSE

Newspaper publication regarding Special Window for transfer and dematerialisation of physical shares of the Company

Format of the Initial Disclosure to be made by an entity identified as a Large Corporate : Annexure A

17-Apr-2026 | Source : BSE

Format of Initial Disclosure to be made by an entity identified as a Large Corporate.

Sr. No. Particulars Details
1Name of CompanyKMC Speciality Hospitals (India) Ltd
2CIN NO.L85110TN1982PLC009781
3 Outstanding borrowing of company as on 31st March / 31st December as applicable (in Rs cr) 71.35
4Highest Credit Rating during the previous FY AA-
4aName of the Credit Rating Agency issuing the Credit Rating mentioned in (4)INDIA RATINGS AND RESEARCH PVT. LTD.
5Name of Stock Exchange# in which the fine shall be paid in case of shortfall in the required borrowing under the frameworkBSE


We confirm that we are a Large Corporate as per the applicability criteria given under the SEBI circular SEBI/HO/DDHS/CIR/P/2018/144 dated November 26 2018. No


Name of the Company Secretary: Indumathi P
Designation: Company Secretary and Compliance Officer
EmailId: cs.kmcshil@kauveryhospital.com
Name of the Chief Financial Officer: K Anand Babu
Designation: Chief Financial Officer
EmailId: cfo@kauveryhealthcare.com

Date: 17/04/2026

Note: In terms para of 3.2(ii) of the circular beginning F.Y 2022 in the event of shortfall in the mandatory borrowing through debt securities a fine of 0.2% of the shortfall shall be levied by Stock Exchanges at the end of the two-year block period. Therefore an entity identified as LC shall provide in its initial disclosure for a financial year the name of Stock Exchange to which it would pay the fine in case of shortfall in the mandatory borrowing through debt markets.

Corporate Actions stock-summary

stock-summary
BOARD MEETING

No Upcoming Board Meetings

stock-summary
DIVIDEND

No Dividend history available

stock-summary
SPLITS

No Splits history available

stock-summary
BONUS

No Bonus history available

stock-summary
RIGHTS

KMC Speciality Hospitals (India) Ltd has announced 12:1 rights issue, ex-date: 06 Jan 11

stock-summaryKey Factors

Quality key factors stock-summary

Factor
Value
Sales Growth (5y)
24.28%
EBIT Growth (5y)
32.44%
EBIT to Interest (avg)
22.32
Debt to EBITDA (avg)
1.29
Net Debt to Equity (avg)
0.31
Sales to Capital Employed (avg)
0.99
Tax Ratio
29.63%
Dividend Payout Ratio
0
Pledged Shares
0
Institutional Holding
0.00%
ROCE (avg)
24.37%
ROE (avg)
21.74%

Valuation key factors

Factor
Value
P/E Ratio
45
Industry P/E
61
Price to Book Value
9.00
EV to EBIT
29.92
EV to EBITDA
21.89
EV to Capital Employed
7.11
EV to Sales
5.96
PEG Ratio
0.85
Dividend Yield
NA
ROCE (Latest)
20.29%
ROE (Latest)
20.10%

Technicals key factors

Indicator
Weekly
Monthly
MACD
Bullish
Bullish
RSI
Bearish
Bearish
Bollinger Bands
Bullish
Bullish
Moving Averages
Bullish (Daily)
KST
Bullish
Bullish
Dow Theory
Mildly Bullish
Mildly Bullish
stock-summary Technical Indicator Scale: Bearish, Mildly Bearish, Sideways, Mildly Bullish, Bullish  Turned 
stock-summaryShareholding
Shareholding Snapshot : Mar 2026stock-summary
Shareholding Compare (%holding) stock-summary
Majority shareholders

Promoters

Pledged Promoter Holdings

None

Mutual Funds

Held by 4 Schemes (0.0%)

FIIs

Held by 1 FIIs (0.0%)

Promoter with highest holding

Sri Kauvery Medical Care (india)limited (75.0%)

Highest Public shareholder

D Chitra (1.36%)

Individual Investors Holdings

22.02%

stock-summaryFinancial
[
  {
    "link": "quarterly",
    "btn_text": "All Quarterly Results",
    "header": "Quarterly Results Snapshot (Standalone) - Mar'26 - QoQ",
    "rhs": [
      {
        "prefix": "Net Sales ",
        "suffix": "QoQ Growth in quarter ended Mar 2026 is 0.23% vs 9.56% in Dec 2025",
        "dir": -1
      },
      {
        "prefix": "Standalone Net Profit ",
        "suffix": "QoQ Growth in quarter ended Mar 2026 is 6.55% vs 26.66% in Dec 2025",
        "dir": -1
      }
    ],
    "table": {
      "header": [
        "Mar'26",
        "Dec'25",
        "Change(%)"
      ],
      "body": [
        {
          "field": "Net Sales",
          "val1": "82.25",
          "val2": "82.06",
          "chgp": "0.23%",
          "chgp_class": "positive"
        },
        {
          "field": "Operating Profit (PBDIT) excl Other Income",
          "val1": "25.88",
          "val2": "24.76",
          "chgp": "4.52%",
          "chgp_class": "positive"
        },
        {
          "field": "Interest",
          "val1": "2.03",
          "val2": "2.07",
          "chgp": "-1.93%",
          "chgp_class": "positive"
        },
        {
          "field": "Exceptional Items",
          "val1": "0.00",
          "val2": "0.00",
          "chgp": "",
          "chgp_class": "neutral"
        },
        {
          "field": "Standalone Net Profit",
          "val1": "14.63",
          "val2": "13.73",
          "chgp": "6.55%",
          "chgp_class": "positive"
        },
        {
          "field": "Operating Profit Margin (Excl OI)",
          "val1": "31.47%",
          "val2": "30.17%",
          "chgp": "1.30%",
          "chgp_class": "positive"
        }
      ]
    }
  },
  {
    "link": "half-yearly",
    "btn_text": "All Half Yearly Results",
    "header": "Half Yearly Results Snapshot (Standalone) - Sep'25",
    "rhs": [
      {
        "prefix": "Net Sales ",
        "suffix": " Growth in half year ended Sep 2025 is 29.41% vs 31.43% in Sep 2024",
        "dir": -1
      },
      {
        "prefix": "Standalone Net Profit ",
        "suffix": " Growth in half year ended Sep 2025 is 95.74% vs -32.01% in Sep 2024",
        "dir": 1
      }
    ],
    "table": {
      "header": [
        "Sep'25",
        "Sep'24",
        "Change(%)"
      ],
      "body": [
        {
          "field": "Net Sales",
          "val1": "141.45",
          "val2": "109.30",
          "chgp": "29.41%",
          "chgp_class": "positive"
        },
        {
          "field": "Operating Profit (PBDIT) excl Other Income",
          "val1": "37.30",
          "val2": "25.46",
          "chgp": "46.50%",
          "chgp_class": "positive"
        },
        {
          "field": "Interest",
          "val1": "4.21",
          "val2": "4.77",
          "chgp": "-11.74%",
          "chgp_class": "positive"
        },
        {
          "field": "Exceptional Items",
          "val1": "0.00",
          "val2": "0.00",
          "chgp": "",
          "chgp_class": "neutral"
        },
        {
          "field": "Standalone Net Profit",
          "val1": "18.38",
          "val2": "9.39",
          "chgp": "95.74%",
          "chgp_class": "positive"
        },
        {
          "field": "Operating Profit Margin (Excl OI)",
          "val1": "26.37%",
          "val2": "23.29%",
          "chgp": "3.08%",
          "chgp_class": "positive"
        }
      ]
    }
  },
  {
    "link": "nine-monthly",
    "btn_text": "All Nine Monthly Results",
    "header": "Nine Monthly Results Snapshot (Standalone) - Dec'25",
    "rhs": [
      {
        "prefix": "Net Sales ",
        "suffix": "YoY Growth in nine months ended Dec 2025 is 30.97% vs 29.01% in Dec 2024",
        "dir": 1
      },
      {
        "prefix": "Standalone Net Profit ",
        "suffix": "YoY Growth in nine months ended Dec 2025 is 90.00% vs -27.47% in Dec 2024",
        "dir": 1
      }
    ],
    "table": {
      "header": [
        "Dec'25",
        "Dec'24",
        "Change(%)"
      ],
      "body": [
        {
          "field": "Net Sales",
          "val1": "223.51",
          "val2": "170.66",
          "chgp": "30.97%",
          "chgp_class": "positive"
        },
        {
          "field": "Operating Profit (PBDIT) excl Other Income",
          "val1": "62.06",
          "val2": "41.47",
          "chgp": "49.65%",
          "chgp_class": "positive"
        },
        {
          "field": "Interest",
          "val1": "6.28",
          "val2": "7.10",
          "chgp": "-11.55%",
          "chgp_class": "positive"
        },
        {
          "field": "Exceptional Items",
          "val1": "0.00",
          "val2": "0.00",
          "chgp": "",
          "chgp_class": "neutral"
        },
        {
          "field": "Standalone Net Profit",
          "val1": "32.11",
          "val2": "16.90",
          "chgp": "90.00%",
          "chgp_class": "positive"
        },
        {
          "field": "Operating Profit Margin (Excl OI)",
          "val1": "27.77%",
          "val2": "24.30%",
          "chgp": "3.47%",
          "chgp_class": "positive"
        }
      ]
    }
  },
  {
    "link": "annual",
    "btn_text": "All Annual Results",
    "header": "Annual Results Snapshot (Standalone) - Mar'26",
    "rhs": [
      {
        "prefix": "Net Sales ",
        "suffix": "YoY Growth in year ended Mar 2026 is 32.03% vs 30.71% in Mar 2025",
        "dir": 1
      },
      {
        "prefix": "Standalone Net Profit ",
        "suffix": "YoY Growth in year ended Mar 2026 is 118.06% vs -29.46% in Mar 2025",
        "dir": 1
      }
    ],
    "table": {
      "header": [
        "Mar'26",
        "Mar'25",
        "Change(%)"
      ],
      "body": [
        {
          "field": "Net Sales",
          "val1": "305.77",
          "val2": "231.60",
          "chgp": "32.03%",
          "chgp_class": "positive"
        },
        {
          "field": "Operating Profit (PBDIT) excl Other Income",
          "val1": "87.93",
          "val2": "56.89",
          "chgp": "54.56%",
          "chgp_class": "positive"
        },
        {
          "field": "Interest",
          "val1": "8.31",
          "val2": "9.42",
          "chgp": "-11.78%",
          "chgp_class": "positive"
        },
        {
          "field": "Exceptional Items",
          "val1": "0.00",
          "val2": "0.00",
          "chgp": "",
          "chgp_class": "neutral"
        },
        {
          "field": "Standalone Net Profit",
          "val1": "46.73",
          "val2": "21.43",
          "chgp": "118.06%",
          "chgp_class": "positive"
        },
        {
          "field": "Operating Profit Margin (Excl OI)",
          "val1": "28.76%",
          "val2": "24.56%",
          "chgp": "4.20%",
          "chgp_class": "positive"
        }
      ]
    }
  }
]

Quarterly Results Snapshot (Standalone) - Mar'26 - QoQstock-summary

Mar'26
Dec'25
Change(%)
Net Sales
82.25
82.06
0.23%
Operating Profit (PBDIT) excl Other Income
25.88
24.76
4.52%
Interest
2.03
2.07
-1.93%
Exceptional Items
0.00
0.00
Standalone Net Profit
14.63
13.73
6.55%
Operating Profit Margin (Excl OI)
31.47%
30.17%
1.30%
Values in Rs Cr.
Direction Arrows
Net Sales

QoQ Growth in quarter ended Mar 2026 is 0.23% vs 9.56% in Dec 2025

Direction Arrows
Standalone Net Profit

QoQ Growth in quarter ended Mar 2026 is 6.55% vs 26.66% in Dec 2025

Half Yearly Results Snapshot (Standalone) - Sep'25stock-summary

Sep'25
Sep'24
Change(%)
Net Sales
141.45
109.30
29.41%
Operating Profit (PBDIT) excl Other Income
37.30
25.46
46.50%
Interest
4.21
4.77
-11.74%
Exceptional Items
0.00
0.00
Standalone Net Profit
18.38
9.39
95.74%
Operating Profit Margin (Excl OI)
26.37%
23.29%
3.08%
Values in Rs Cr.
Direction Arrows
Net Sales

Growth in half year ended Sep 2025 is 29.41% vs 31.43% in Sep 2024

Direction Arrows
Standalone Net Profit

Growth in half year ended Sep 2025 is 95.74% vs -32.01% in Sep 2024

Nine Monthly Results Snapshot (Standalone) - Dec'25stock-summary

Dec'25
Dec'24
Change(%)
Net Sales
223.51
170.66
30.97%
Operating Profit (PBDIT) excl Other Income
62.06
41.47
49.65%
Interest
6.28
7.10
-11.55%
Exceptional Items
0.00
0.00
Standalone Net Profit
32.11
16.90
90.00%
Operating Profit Margin (Excl OI)
27.77%
24.30%
3.47%
Values in Rs Cr.
Direction Arrows
Net Sales

YoY Growth in nine months ended Dec 2025 is 30.97% vs 29.01% in Dec 2024

Direction Arrows
Standalone Net Profit

YoY Growth in nine months ended Dec 2025 is 90.00% vs -27.47% in Dec 2024

Annual Results Snapshot (Standalone) - Mar'26stock-summary

Mar'26
Mar'25
Change(%)
Net Sales
305.77
231.60
32.03%
Operating Profit (PBDIT) excl Other Income
87.93
56.89
54.56%
Interest
8.31
9.42
-11.78%
Exceptional Items
0.00
0.00
Standalone Net Profit
46.73
21.43
118.06%
Operating Profit Margin (Excl OI)
28.76%
24.56%
4.20%
Values in Rs Cr.
Direction Arrows
Net Sales

YoY Growth in year ended Mar 2026 is 32.03% vs 30.71% in Mar 2025

Direction Arrows
Standalone Net Profit

YoY Growth in year ended Mar 2026 is 118.06% vs -29.46% in Mar 2025

stock-summaryCompany CV
About KMC Speciality Hospitals (India) Ltd stock-summary
stock-summary
KMC Speciality Hospitals (India) Ltd
Micro Cap
Hospital
KMC Speciality Hospitals (India) Limited was originally incorporated as 'Advanced Medical Care Private Limited' on December 31, 1982 and was converted into a Public Limited Company on July 15, 1988. The name of the Company was changed to 'Seahorse Hospitals Limited' on March 21, 1995 and to its current name 'KMC Speciality Hospitals (India) Limited' with effect from October 24, 2008. The Company is a part of the KMC Group of Hospitals based at Tiruchirappalli.
Company Coordinates stock-summary
Company Details
6 Royal Road, Cantonment Trichy Tamil Nadu : 620001
stock-summary
Tel: 91-431-4077777
stock-summary
cs.kmcshil@kauveryhospital.com
Registrar Details
Cameo Corporate Services Ltd , Subramanian Buildings No 1 , Club House Road, Chennai