
Compare KMC Speciality with Similar Stocks
Dashboard
Strong ability to service debt as the company has a low Debt to EBITDA ratio of 0.95 times
Healthy long term growth as Operating profit has grown by an annual rate 31.16%
With a growth in Operating Profit of 7.34%, the company declared Outstanding results in Mar 26
Market Beating performance in long term as well as near term
Total Returns (Price + Dividend) 
KMC Speciality for the last several years.
Risk Adjusted Returns v/s
Returns Beta

News
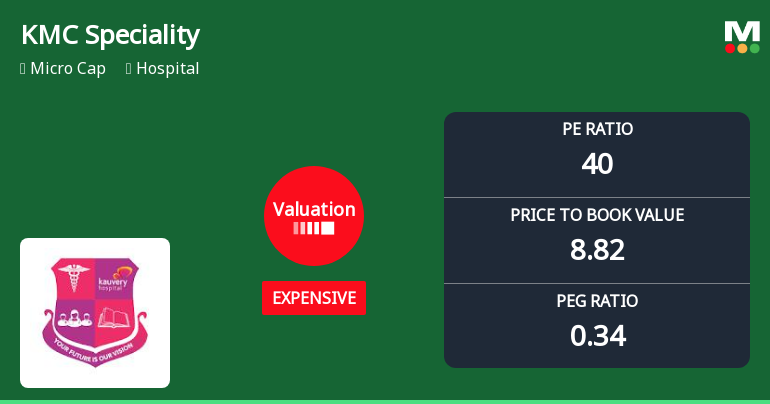
KMC Speciality Hospitals: Valuation Shift Signals Price Attractiveness Change Amid Strong Returns
KMC Speciality Hospitals (India) Ltd has seen a notable shift in its valuation parameters, moving from a fair to an expensive rating despite robust operational metrics and impressive stock returns. This transition reflects changing market perceptions amid a micro-cap hospital sector landscape marked by mixed valuations and contrasting peer comparisons.
Read full news article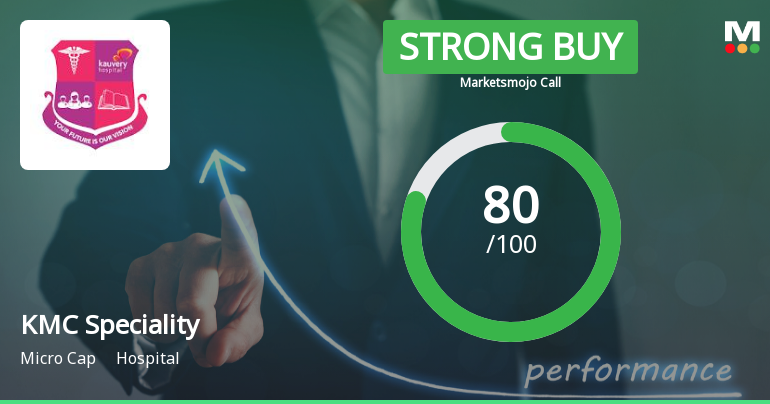
KMC Speciality Hospitals Upgraded to Strong Buy on Robust Financial and Valuation Metrics
KMC Speciality Hospitals (India) Ltd has been upgraded from a Buy to a Strong Buy rating, reflecting its outstanding financial performance, attractive valuation metrics, solid quality indicators, and positive technical signals. The upgrade, effective from 8 June 2026, is underpinned by a comprehensive analysis across four key parameters: Quality, Valuation, Financial Trend, and Technicals.
Read full news article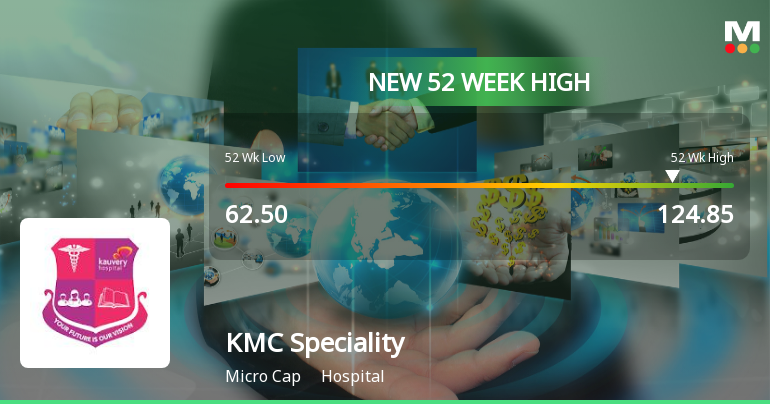
Broad-Based Technical Strength Lifts KMC Speciality Hospitals (India) Ltd to 52-Week High of Rs 124.85
With a remarkable 73.69% gain over the past year, KMC Speciality Hospitals (India) Ltd surged to a fresh 52-week high of Rs 124.85 on 3 Jun 2026, defying the broader market's downward trend and showcasing robust technical momentum across multiple timeframes.
Read full news article Announcements
Announcement under Regulation 30 (LODR)-Investor Presentation
05-Jun-2026 | Source : BSEInvestor Presentation for the quarter and year ended 31st March 2026
Compliances-Reg.24(A)-Annual Secretarial Compliance
29-May-2026 | Source : BSEPursuant to Regulation 24A of SEBI (LODR) Regulations 2015 please find enclosed the Annual Secretarial Compliance Report of the Company for the financial year ended March 31 2026 duly certified by the Practicing Company Secretary.
Announcement under Regulation 30 (LODR)-Change in Management
29-May-2026 | Source : BSEIntimation under Regulation 30 of SEBI (LODR) Regulations 2015 - Appointment of Internal Auditor for FY 2026-27
Corporate Actions

No Upcoming Board Meetings

No Dividend history available

No Splits history available

No Bonus history available

KMC Speciality Hospitals (India) Ltd has announced 12:1 rights issue, ex-date: 06 Jan 11
Quality key factors
Valuation key factors
Technicals key factors
 Technical Indicator Scale: Bearish, Mildly Bearish, Sideways, Mildly Bullish, Bullish Turned
 Shareholding Snapshot : Mar 2026
Shareholding Compare (%holding)
Promoters
None
Held by 4 Schemes (0.0%)
Held by 1 FIIs (0.0%)
Sri Kauvery Medical Care (india)limited (75.0%)
D Chitra (1.36%)
22.02%
Quarterly Results Snapshot (Standalone) - Mar'26 - QoQ

QoQ Growth in quarter ended Mar 2026 is 0.23% vs 9.56% in Dec 2025
QoQ Growth in quarter ended Mar 2026 is 6.55% vs 26.66% in Dec 2025
Half Yearly Results Snapshot (Standalone) - Sep'25
Growth in half year ended Sep 2025 is 29.41% vs 31.43% in Sep 2024

Growth in half year ended Sep 2025 is 95.74% vs -32.01% in Sep 2024
Nine Monthly Results Snapshot (Standalone) - Dec'25
YoY Growth in nine months ended Dec 2025 is 30.97% vs 29.01% in Dec 2024
YoY Growth in nine months ended Dec 2025 is 90.00% vs -27.47% in Dec 2024
Annual Results Snapshot (Standalone) - Mar'26
YoY Growth in year ended Mar 2026 is 32.03% vs 30.71% in Mar 2025
YoY Growth in year ended Mar 2026 is 118.06% vs -29.46% in Mar 2025
About KMC Speciality Hospitals (India) Ltd

Company Coordinates


