
Compare Knowledge Marine with Similar Stocks
Dashboard
Strong ability to service debt as the company has a low Debt to EBITDA ratio of 1.86 times
Healthy long term growth as Net Sales has grown by an annual rate of 53.70% and Operating profit at 47.85%
Positive results in Mar 26
Increasing Participation by Institutional Investors
Market Beating performance in long term as well as near term
Stock DNA
Miscellaneous
INR 4,666 Cr (Small Cap)
60.00
34
0.00%
0.26
13.88%
8.06
Total Returns (Price + Dividend) 
Knowledge Marine for the last several years.
Risk Adjusted Returns v/s
Returns Beta

News
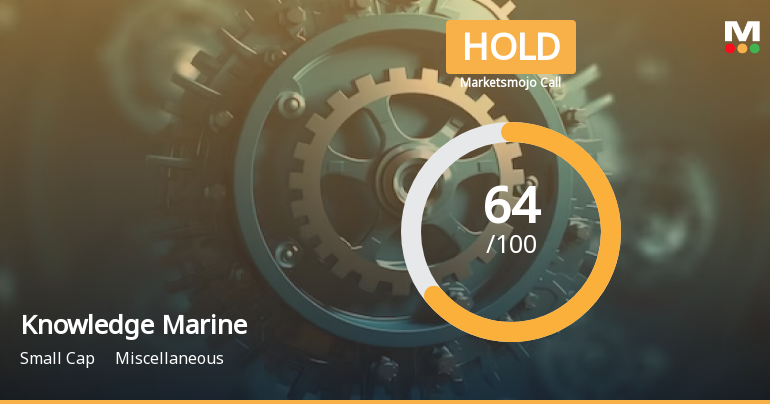
Knowledge Marine & Engineering Works Ltd is Rated Hold
Knowledge Marine & Engineering Works Ltd is rated 'Hold' by MarketsMOJO, with this rating last updated on 01 June 2026. However, the analysis and financial metrics discussed here reflect the stock's current position as of 04 June 2026, providing investors with an up-to-date view of its fundamentals, returns, and overall outlook.
Read full news article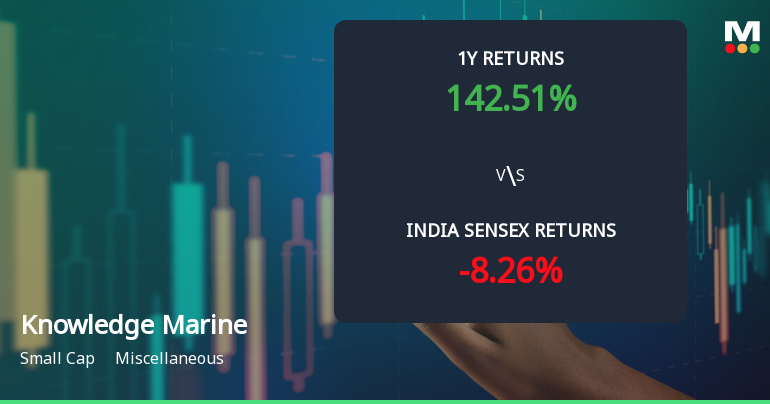
Knowledge Marine & Engineering Works Ltd Technical Momentum Shifts to Bullish Amid Mixed Signals
Knowledge Marine & Engineering Works Ltd has experienced a notable shift in price momentum, with technical indicators signalling a transition from mildly bullish to bullish trends. The stock’s recent performance, supported by positive MACD and KST readings, alongside improving moving averages, suggests renewed investor interest despite mixed signals from Dow Theory and RSI metrics.
Read full news article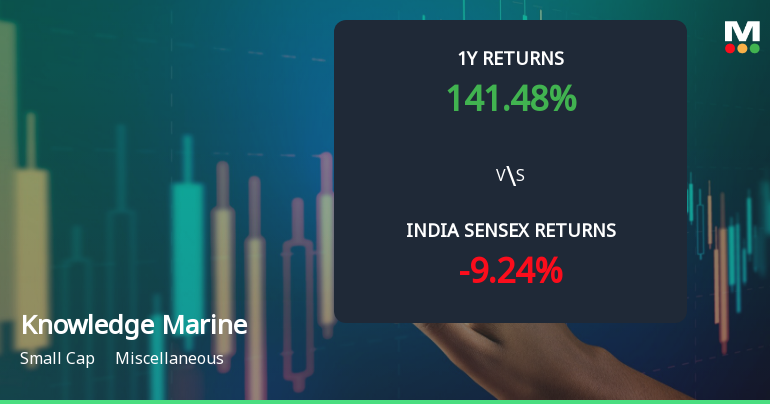
Knowledge Marine & Engineering Works Ltd Sees Technical Momentum Shift Amid Price Decline
Knowledge Marine & Engineering Works Ltd, a small-cap player in the miscellaneous sector, has experienced a notable shift in its technical momentum, reflecting a transition from a bullish to a mildly bullish trend. Despite a sharp day decline of 9.96%, the stock’s longer-term technical indicators present a nuanced picture, with mixed signals from MACD, RSI, moving averages, and other momentum oscillators. This article analyses these technical parameters in detail, placing the stock’s recent price action in the context of broader market movements and historical returns.
Read full news article Announcements
Announcement under Regulation 30 (LODR)-Analyst / Investor Meet - Outcome
05-Jun-2026 | Source : BSEWe hereby inform you that the Audio Recordings of earnings call on the Financial Results of the Knowledge Marine & Engineering Works Limited for the quarter and year ended March 31 2026 is made available on the website of the Company at https://www.kmew.in/investor-information.html.
Announcement under Regulation 30 (LODR)-Code of Conduct under SEBI (PIT) Regulations 2015
04-Jun-2026 | Source : BSEPlease find attached herewith the form C disclosure in respect of purchase of shares by Designated Person of the Company.
Announcement under Regulation 30 (LODR)-Newspaper Publication
03-Jun-2026 | Source : BSEPlease find attached herewith copies of Newspaper Advertisement regarding completion of dispatch of Postal Ballot Notice Remote e-voting and other details published in Financial Express in English Language and in Mumbai Lakshadweep in Marathi Language on June 03 2026.
Corporate Actions

No Upcoming Board Meetings

No Dividend history available

Knowledge Marine & Engineering Works Ltd has announced 5:10 stock split, ex-date: 22 Dec 25

No Bonus history available

No Rights history available
Quality key factors
Valuation key factors
Technicals key factors
 Technical Indicator Scale: Bearish, Mildly Bearish, Sideways, Mildly Bullish, Bullish Turned
 Shareholding Snapshot : Mar 2026
Shareholding Compare (%holding)
Promoters
None
Held by 1 Schemes (1.62%)
Held by 20 FIIs (11.75%)
Kanak Sujay Kewalramani (29.22%)
Infinity Direct Capital (4.47%)
22.87%
Quarterly Results Snapshot (Consolidated) - Mar'26 - QoQ

QoQ Growth in quarter ended Mar 2026 is -24.88% vs 79.41% in Dec 2025
QoQ Growth in quarter ended Mar 2026 is -13.87% vs 171.70% in Dec 2025
Half Yearly Results Snapshot (Consolidated) - Sep'25
Growth in half year ended Sep 2025 is 3.17% vs 68.64% in Sep 2024
Growth in half year ended Sep 2025 is -1.71% vs 157.14% in Sep 2024
Nine Monthly Results Snapshot (Consolidated) - Dec'25

YoY Growth in nine months ended Dec 2025 is 23.12% vs -12.19% in Dec 2024
YoY Growth in nine months ended Dec 2025 is 36.31% vs -23.00% in Dec 2024
Annual Results Snapshot (Consolidated) - Mar'26
YoY Growth in year ended Mar 2026 is 27.69% vs 22.70% in Mar 2025
YoY Growth in year ended Mar 2026 is 58.20% vs 62.41% in Mar 2025
About Knowledge Marine & Engineering Works Ltd

Company Coordinates


