
Compare KORE Group Holdings, Inc. with Similar Stocks
Dashboard
With a Negative Book Value, the company has a Weak Long Term Fundamental Strength
- Poor long term growth as Operating profit has grown by an annual rate -225.95% of over the last 5 years
- Low ability to service debt as the company has a high Debt to EBITDA ratio of 11.94 times
Risky - Negative Operating Profits
Stock DNA
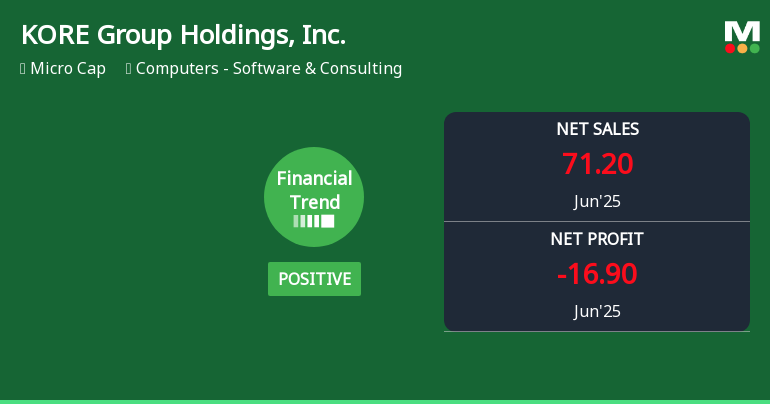
Computers - Software & Consulting
USD 82 Million (Micro Cap)
NA (Loss Making)
NA
0.00%
-2.90
33.60%
-0.57
Total Returns (Price + Dividend) 
KORE Group Holdings, Inc. for the last several years.
Risk Adjusted Returns v/s
News
KORE Group Holdings, Inc. Experiences Revision in Its Stock Evaluation Amid Strong Performance Metrics
KORE Group Holdings, Inc. reported strong liquidity with an operating cash flow of USD 10.99 million and efficient inventory management, reflected in a turnover ratio of 27.03 times. However, the company faced challenges with a pre-tax loss of USD 8.06 million despite a year-to-date stock return of 27.95%.
Read full news article Announcements

Corporate Actions
Quality key factors
Valuation key factors
Technicals key factors
 Technical Indicator Scale: Bearish, Mildly Bearish, Sideways, Mildly Bullish, Bullish Turned
 Shareholding Snapshot : Sep 2025
Shareholding Compare (%holding)
Domestic Funds
Held in 4 Schemes (2.38%)
Held by 8 Foreign Institutions (0.15%)
Quarterly Results Snapshot (Consolidated) - Sep'25 - QoQ

QoQ Growth in quarter ended Sep 2025 is -3.51% vs -1.25% in Jun 2025

QoQ Growth in quarter ended Sep 2025 is 24.85% vs -13.42% in Jun 2025
Annual Results Snapshot (Consolidated) - Dec'24
YoY Growth in year ended Dec 2024 is 3.43% vs 3.06% in Dec 2023
YoY Growth in year ended Dec 2024 is 12.51% vs -57.25% in Dec 2023
About KORE Group Holdings, Inc.

Company Coordinates


