
Compare Kothari Products with Similar Stocks
Dashboard
With a Operating Losses, the company has a Weak Long Term Fundamental Strength
- Company's ability to service its debt is weak with a poor EBIT to Interest (avg) ratio of -6.26
- The company has been able to generate a Return on Equity (avg) of 1.31% signifying low profitability per unit of shareholders funds
Flat results in Mar 26
Risky - Negative EBITDA
Underperformed the market in the last 1 year
Stock DNA
Trading & Distributors
INR 421 Cr (Micro Cap)
18.00
21
0.00%
-0.01
2.05%
0.36
Total Returns (Price + Dividend) 
Latest dividend: 1 per share ex-dividend date: Sep-12-2019
Risk Adjusted Returns v/s
Returns Beta

News
Are Kothari Products Ltd latest results good or bad?
Kothari Products Ltd's latest financial results for Q4 FY26 present a complex picture. The company reported a significant surge in net sales, achieving ₹316.59 crores, which reflects a 95.55% increase compared to the previous quarter. This marks the highest quarterly revenue in recent periods and a year-on-year growth of 42.08%. However, this impressive top-line growth is overshadowed by the company's inability to translate it into profitability, as evidenced by a consolidated net loss of ₹1.95 crores, a stark contrast to the profit of ₹9.91 crores in the prior quarter. The operating performance reveals ongoing structural challenges, with an operating margin of -5.26%, indicating persistent negative margins for the seventh consecutive quarter. While there was a slight improvement from the previous quarter's margin of -7.88%, the overall trend remains concerning. The company's reliance on other income has d...
Read full news article
Kothari Products Q4 FY26: Sharp Losses Deepen Amid Operational Struggles
Kothari Products Ltd., a micro-cap trading and distribution company with a market capitalisation of ₹466.00 crores, reported a consolidated net loss of ₹1.95 crores for Q4 FY26, marking a dramatic reversal from the ₹9.91 crores profit recorded in Q3 FY26. The 119.68% quarter-on-quarter decline reflects deepening operational challenges that have plagued the company throughout the fiscal year. Following the results announcement, the stock traded at ₹73.17 on June 01, 2026, down 4.49% from the previous close, with shares hovering 32.56% below their 52-week high of ₹108.50.
Read full news article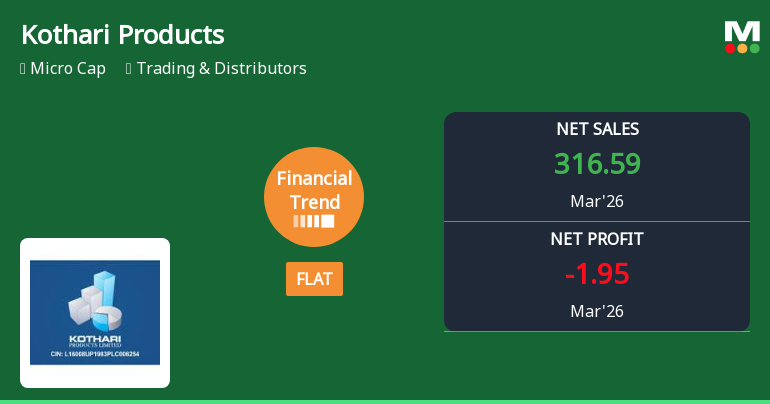
Kothari Products Ltd Reports Flat Quarterly Performance Amid Mixed Financial Signals
Kothari Products Ltd, a micro-cap player in the Trading & Distributors sector, has reported a flat financial performance for the quarter ended March 2026, signalling a stabilisation after a period of negative trends. Despite a notable increase in net sales and a higher profit after tax (PAT) over nine months, the company’s quarterly earnings per share (EPS) and PAT have deteriorated sharply, reflecting ongoing challenges in profitability.
Read full news article Announcements
Announcement under Regulation 30 (LODR)-Newspaper Publication
01-Jun-2026 | Source : BSEPUBLISHED COPIES OF AUDITED FINANCIAL RESULTS
Compliances-Reg.24(A)-Annual Secretarial Compliance
29-May-2026 | Source : BSESECRETARIAL COMPLIANCE REPORT
RESULTS FOR THE YEAR ENDED 31.03.2026
29-May-2026 | Source : BSERESULTS FOR THE YEAR ENDED 31.03.2026
Corporate Actions

No Upcoming Board Meetings

Kothari Products Ltd has declared 10% dividend, ex-date: 12 Sep 19

No Splits history available

Kothari Products Ltd has announced 1:1 bonus issue, ex-date: 18 Feb 25

No Rights history available
Quality key factors
Valuation key factors
Technicals key factors
 Technical Indicator Scale: Bearish, Mildly Bearish, Sideways, Mildly Bullish, Bullish Turned
 Shareholding Snapshot : Mar 2026
Shareholding Compare (%holding)
Promoters
None
Held by 0 Schemes
Held by 0 FIIs
Deepak Kothari (59.27%)
Magnus Properties Private Limited (5.66%)
10.28%
Quarterly Results Snapshot (Consolidated) - Mar'26 - QoQ

QoQ Growth in quarter ended Mar 2026 is 95.55% vs -42.76% in Dec 2025

QoQ Growth in quarter ended Mar 2026 is -119.68% vs 106.03% in Dec 2025
Half Yearly Results Snapshot (Consolidated) - Sep'25
Growth in half year ended Sep 2025 is 3.45% vs 4.78% in Sep 2024
Growth in half year ended Sep 2025 is 121.98% vs -1,045.27% in Sep 2024
Nine Monthly Results Snapshot (Consolidated) - Dec'25
YoY Growth in nine months ended Dec 2025 is -5.70% vs 2.65% in Dec 2024
YoY Growth in nine months ended Dec 2025 is 133.71% vs -595.30% in Dec 2024
Annual Results Snapshot (Consolidated) - Mar'26
YoY Growth in year ended Mar 2026 is 5.42% vs -3.48% in Mar 2025
YoY Growth in year ended Mar 2026 is 135.32% vs -389.29% in Mar 2025
About Kothari Products Ltd

Company Coordinates


