
Compare Kotia Enterprise with Similar Stocks
Dashboard
Weak Long Term Fundamental Strength with an average Return on Equity (ROE) of 3.01%
- Poor long term growth as Net Sales has grown by an annual rate of 9.16% and Operating profit at 17.40% over the last 5 years
- Company's ability to service its debt is weak with a poor EBIT to Interest (avg) ratio of -0.15
With ROE of 8.2, it has a Very Expensive valuation with a 0.6 Price to Book Value
Total Returns (Price + Dividend) 
Kotia Enterprise for the last several years.
Risk Adjusted Returns v/s
Returns Beta

News
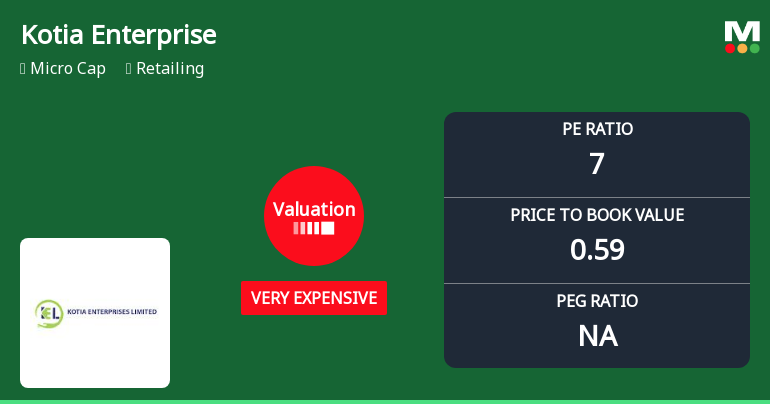
Kotia Enterprises Ltd Valuation Shift Signals Changing Price Attractiveness
Kotia Enterprises Ltd, a micro-cap player in the retailing sector, has undergone a notable change in its valuation parameters, shifting from a risky profile to one that currently does not qualify under traditional valuation risk metrics. Despite this, the company’s low price-to-earnings (P/E) and price-to-book value (P/BV) ratios, combined with subdued returns on capital, suggest a complex investment case that warrants careful analysis.
Read full news article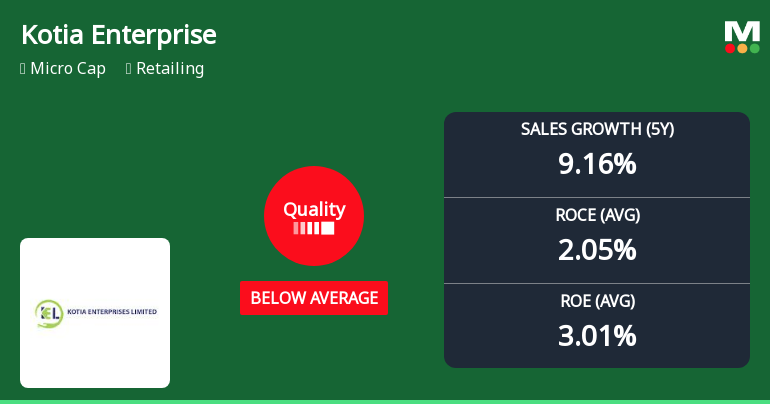
Kotia Enterprises Ltd Quality Grade Downgrade Highlights Fundamental Weaknesses
Kotia Enterprises Ltd, a micro-cap player in the retailing sector, has recently undergone a significant downgrade in its quality grading, shifting from 'Does Not Qualify' to 'Below Average' as of 1 June 2026. This change reflects a deterioration in key business fundamentals, including profitability ratios, debt metrics, and operational efficiency, raising concerns about the company’s financial health and investment appeal.
Read full news article Announcements
Announcement under Regulation 30 (LODR)-Newspaper Publication
30-May-2026 | Source : BSEPursuant to Regulation 30 & 47 of SEBI (LODR) Regulations 2015 please find enclosed herewith relevant page of Financial Express (English) and Jansatta (Hindi) newspaper dated 30-05-2026 publishing extracts of AFRs of the Company for the quarter and financial year ended 31-03-2026 upon approval by the Board of Directors at its meeting held on 29-05-2026.
Financial Results For The FY 2025-26
29-May-2026 | Source : BSEFinancial Results for the Financial Year ended 31-03-2026
Board Meeting Outcome for Outcome Of The Board Meeting Held On Friday May 29 2026
29-May-2026 | Source : BSEThis is to inform you that the meeting of the Board of Directors of the Company held today i.e. Friday 29th May 2026 (which commences at 02:00 P.M. and concluded at 3:15 P.M.) has inter- alia transacted the following business: - 1. Approved the Audited Financial results of the Company for the quarter and financial year ended 31st March 2026. 2. Approved the copy of the Audit Report in accordance with Regulation 33 of the SEBI (Listing Obligations Disclosure Requirements) Regulations 2015.
Corporate Actions

No Upcoming Board Meetings

No Dividend history available

No Splits history available

No Bonus history available

No Rights history available
Quality key factors
Valuation key factors
Technicals key factors
 Technical Indicator Scale: Bearish, Mildly Bearish, Sideways, Mildly Bullish, Bullish Turned
 Shareholding Snapshot : Mar 2026
Shareholding Compare (%holding)
Non Institution
None
Held by 0 Schemes
Held by 0 FIIs
None
Panchsheel Portfolio Consultants Private Limited (10.12%)
25.76%
Quarterly Results Snapshot (Standalone) - Mar'26 - YoY

YoY Growth in quarter ended Mar 2026 is 0.00% vs -100.00% in Mar 2025

YoY Growth in quarter ended Mar 2026 is -4,340.00% vs 0.00% in Mar 2025
Half Yearly Results Snapshot (Standalone) - Sep'25
Growth in half year ended Sep 2025 is -100.00% vs 0.00% in Sep 2024
Growth in half year ended Sep 2025 is -1,600.00% vs -150.00% in Sep 2024
Nine Monthly Results Snapshot (Standalone) - Dec'25
YoY Growth in nine months ended Dec 2025 is -100.00% vs 0.00% in Dec 2024
YoY Growth in nine months ended Dec 2025 is 0.00% vs -100.00% in Dec 2024
Annual Results Snapshot (Standalone) - Mar'26
YoY Growth in year ended Mar 2026 is 47.19% vs 106.98% in Mar 2025
YoY Growth in year ended Mar 2026 is -4,900.00% vs -400.00% in Mar 2025
About Kotia Enterprises Ltd

Company Coordinates


