Kovil. Lak. Rol.

INR
88.45
0.96 (1.1%)
BSENSE

Sep 03, 12:59 PM

BSE+NSE Vol: 588

  • Price Points
  • Score
  • Mojo Parameters
  • Total Return
  • News and Corporate Actions
  • Key factors
  • Shareholding
  • Financials
  • CompanyCV
stock-summaryPrice Point
High/Low

1Day

52 Week

Valuation
Technical
Day's Volume

CASH

588 (-53.07%) Volume

Shareholding (Jun 2026)

FII

0.00%

Held by 0 FIIs

DII

0.00%

Held by 0 DIIs

Promoter

73.76%

Why is Kovilpatti Lakshmi Roller Flour Mills Ltd falling/rising?

03-Sep-2026

As of 02-Sep, Kovilpatti Lakshmi Roller Flour Mills Ltd's stock price is rising to 87.49, showing a 1.77% increase and outperforming its sector. Despite a year-to-date decline of 12.51%, the recent uptick suggests positive investor sentiment and potential short-term recovery.

As of 02-Sep, Kovilpatti Lakshmi Roller Flour Mills Ltd's stock price is rising, currently at 87.49, reflecting a change of 1.52 (1.77%) upward. This increase can be attributed to several factors. Notably, the stock has outperformed its sector by 2.53% today, indicating strong relative performance. Additionally, the stock reached an intraday high of Rs 89.8, which is a 4.46% increase, suggesting positive momentum during the trading session.<BR><BR>Investor participation appears to be increasing, as evidenced by a delivery volume of 2,000 shares on September 1, which is a 4.45% rise compared to the 5-day average delivery volume. This uptick in trading activity can contribute to upward price pressure. Furthermore, the stock is currently trading above its 5-day and 20-day moving averages, which can be a bullish signal for investors.<BR><BR>Despite the stock's recent performance, it is important to note that it has experienced declines over longer periods, such as a 12.51% drop year-to-date and a 31.57% decline over the past year. However, the current rise in price may reflect a short-term recovery or positive sentiment among investors.

View full answer

Who are in the management team of Kovil. Lak. Rol.?

01-Sep-2026

The management team of Kovil. Lak. Rol. includes Executive Chairman Suresh Jagannathan, Whole-time Director Sharath Jagannathan, and several independent and non-executive directors, along with Company Secretary S Piramuthu. This diverse team provides both leadership and oversight for the company.

The management team of Kovil. Lak. Rol. includes the following individuals:<BR><BR>1. **Suresh Jagannathan** - Executive Chairman<BR>2. **Sharath Jagannathan** - Whole-time Director<BR>3. **Sudarsan Varadaraj** - Independent Director<BR>4. **K Gnanasekaran** - Non-Executive & Independent Director<BR>5. **Kalyani Jagannathan** - Non-Executive & Independent Director<BR>6. **Ashwin Chandran** - Non-Executive & Independent Director<BR>7. **R Kannan** - Director<BR>8. **S Piramuthu** - Company Secretary & Compliance Officer<BR><BR>This team brings a mix of executive leadership and independent oversight to the company. If you need more specific details about their roles or contributions, feel free to ask!

View full answer

What does Kovil. Lak. Rol. do?

01-Sep-2026

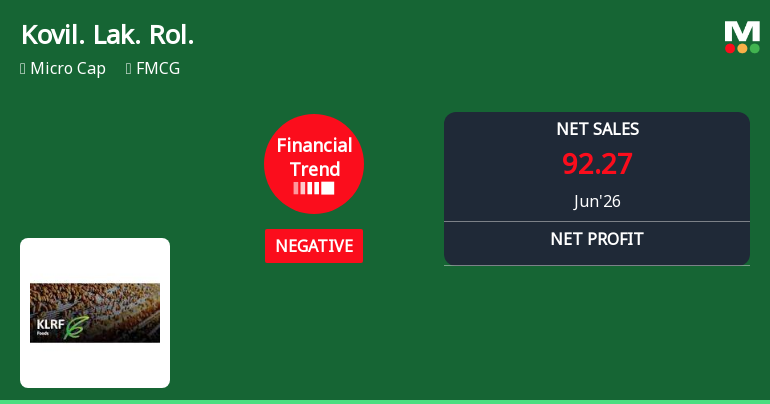
Kovilpatti Lakshmi Roller Flour Mills Ltd specializes in producing and marketing wheat products, with a current milling capacity of 74,900 MT per annum. As of June 2026, it reported net sales of 92 Cr and a net profit of 1 Cr, with a market cap of INR 78 Cr.

Overview:<BR>Kovilpatti Lakshmi Roller Flour Mills Ltd operates in the FMCG industry, specializing in the production and marketing of wheat products.<BR><BR>History:<BR>The company was established on December 16, 1964, with an initial milling capacity of 15,600 MT per annum, which has since expanded to 74,900 MT per annum. Following an amalgamation, the production capacity increased by an additional 96,300 MT. The latest quarterly results reported net sales and profit for June 2026.<BR><BR>Financial Snapshot:<BR>Net Sales: 92 Cr (Quarterly Results - Jun 2026) <BR>Net Profit: 1 Cr (Quarterly Results - Jun 2026) <BR>Market Cap: INR 78 Cr (Micro Cap)<BR><BR>Key Metrics:<BR>P/E: 20.00 <BR>Industry P/E: 44 <BR>Dividend Yield: 0.57% <BR>Debt Equity: 1.09 <BR>Return on Equity: 5.47% <BR>Price to Book: 1.06 <BR><BR>Contact Details:<BR>Address: 75/8 Benares Cape Road, Gangaikondan Tamil Nadu: 627352 <BR>Tel: 91-0462-2486532 <BR>Email: ho@klrf.in <BR>Website: http://www.klrf.in

View full answer

Who are the peers of the Kovil. Lak. Rol.?

01-Sep-2026

Peers of Kovil. Lak. Rol. include Valencia Nutrit., James Warren Tea, Galaxy Supermark, and others. Kovil. Lak. Rol. has a Below Average growth rating and a 1-year return of -32.20%, lower than its peers.

Peers: The peers of Kovil. Lak. Rol. are Valencia Nutrit., James Warren Tea, Galaxy Supermark, Palash Securi., Terai Tea Co, Shri Vasuprada, Simran Farms, IEL, and JHS Sven.Lab.<BR><BR>Quality Snapshot: Excellent management risk is observed at James Warren Tea and IEL, while Average management risk is found at Simran Farms and JHS Sven.Lab. Below Average management risk is noted for Valencia Nutrit., Galaxy Supermark, Palash Securi., Terai Tea Co, Shri Vasuprada, and the rest. Growth is rated as Good for Valencia Nutrit., Average for Palash Securi. and the rest, and Below Average for James Warren Tea, Galaxy Supermark, Terai Tea Co, Shri Vasuprada, Simran Farms, Kovil. Lak. Rol., IEL, and JHS Sven.Lab. Capital Structure is Excellent for James Warren Tea and Palash Securi., Average for IEL, and Below Average for Valencia Nutrit., Galaxy Supermark, Terai Tea Co, Shri Vasuprada, Simran Farms, Kovil. Lak. Rol., and JHS Sven.Lab.<BR><BR>Return Snapshot: The peer with the highest 1-year return is IEL at 7.55%, while the lowest is James Warren Tea at -31.47%. Kovil. Lak. Rol.'s 1-year return is -32.20%, which is lower than both of these peers. Additionally, the six-month returns are negative for James Warren Tea, Galaxy Supermark, IEL, JHS Sven.Lab., and Kovil. Lak. Rol.

View full answer

How big is Kovil. Lak. Rol.?

01-Sep-2026

As of 31st August, Kovilpatti Lakshmi Roller Flour Mills Ltd has a market capitalization of 78.00 Cr, with recent Net Sales of 403.54 Cr and a Net Profit of 5.55 Cr. The company's Shareholder's Funds are 74.56 Cr and Total Assets amount to 193.37 Cr.

As of 31st August, Kovilpatti Lakshmi Roller Flour Mills Ltd has a market capitalization of 78.00 Cr, categorizing it as a Micro Cap company.<BR><BR>In the latest four quarters, the company reported Net Sales of 403.54 Cr and a Net Profit of 5.55 Cr.<BR><BR>The latest annual period for the balance sheet is March 2026, showing Shareholder's Funds of 74.56 Cr and Total Assets of 193.37 Cr.

View full answer

Should I buy, sell or hold Kovilpatti Lakshmi Roller Flour Mills Ltd?

16-Aug-2026

When is the next results date for Kovilpatti Lakshmi Roller Flour Mills Ltd?

07-Aug-2026

The next results date for Kovilpatti Lakshmi Roller Flour Mills Ltd is 14 August 2026.

The next results date for Kovilpatti Lakshmi Roller Flour Mills Ltd is scheduled for 14 August 2026.

View full answer

Are Kovilpatti Lakshmi Roller Flour Mills Ltd latest results good or bad?

03-Jun-2026

Kovilpatti Lakshmi Roller Flour Mills Ltd's latest results show a significant net profit increase of 315.28% to ₹2.99 crore, but revenue declined by 7.16% quarter-on-quarter and operating margins contracted, indicating underlying operational challenges. Overall, the results suggest caution for investors due to these mixed signals.

Kovilpatti Lakshmi Roller Flour Mills Ltd's latest results present a mixed picture. On one hand, the company reported a significant sequential increase in net profit for Q4 FY26, rising by 315.28% to ₹2.99 crore. This improvement is noteworthy and indicates a recovery in profitability compared to the previous quarter.<BR><BR>However, the revenue performance is concerning. The company's net sales decreased by 7.16% quarter-on-quarter and 7.65% year-on-year, falling to ₹99.86 crore. This decline raises questions about the company's ability to maintain its competitive position in the flour milling industry, which is characterized by low margins and intense competition.<BR><BR>Additionally, the operating margin has contracted to 4.66%, down from 5.36% a year ago, reflecting challenges in managing costs and pricing power. The overall financial health is further complicated by a deterioration in return ratios, with return on capital employed (ROCE) and return on equity (ROE) showing significant declines.<BR><BR>In summary, while the net profit growth is a positive sign, the ongoing revenue contraction and margin pressures suggest that the company's fundamentals are under strain. Investors may view the results as a signal of underlying operational challenges, making the overall assessment lean towards caution.

View full answer

Is Kovil. Lak. Rol. overvalued or undervalued?

13-Nov-2025

As of November 12, 2025, Kovil. Lak. Rol. is considered undervalued with a PE ratio of 18.47 and an attractive valuation compared to peers like Hind. Unilever and Nestle India, despite a year-to-date return of -11.38%.

As of 12 November 2025, Kovil. Lak. Rol. has moved from a fair to an attractive valuation grade. The company is currently considered undervalued, with a PE ratio of 18.47, an EV to EBITDA ratio of 7.97, and a PEG ratio of 0.01, indicating significant growth potential relative to its price. <BR><BR>In comparison to its peers, Kovil. Lak. Rol. stands out with a more favorable valuation; for instance, Hind. Unilever has a PE ratio of 53.85, and Nestle India has a PE ratio of 82.31, both categorized as very expensive. Despite recent underperformance, with a year-to-date return of -11.38% compared to the Sensex's 8.10%, the company's attractive valuation metrics suggest it may present a compelling investment opportunity moving forward.

View full answer

How has been the historical performance of Kovil. Lak. Rol.?

13-Nov-2025

Kovil. Lak. Rol. has shown fluctuating financial performance, with net sales increasing significantly to 426.59 Cr by Mar'25, but profits declined, with profit after tax falling to 1.15 Cr. Despite this, cash flow from operating activities improved to 41.00 Cr in Mar'25.

Answer:<BR>The historical performance of Kovil. Lak. Rol. shows a fluctuating trend in key financial metrics over the years.<BR><BR>Breakdown:<BR>Kovil. Lak. Rol. has experienced significant growth in net sales, increasing from 223.92 Cr in Mar'21 to 426.59 Cr in Mar'25. Total operating income followed a similar upward trajectory, reaching 426.59 Cr in Mar'25 from 273.35 Cr in Mar'22. However, total expenditure also rose, culminating at 411.91 Cr in Mar'25, which impacted operating profit, which decreased to 14.68 Cr in Mar'25 from 23.78 Cr in Mar'24. Profit before tax saw a decline to 1.54 Cr in Mar'25, down from 10.51 Cr in Mar'24, while profit after tax also fell to 1.15 Cr from 7.80 Cr in the previous year. The company's total liabilities decreased to 167.57 Cr in Mar'25 from 178.62 Cr in Mar'24, with total assets also declining to 167.57 Cr from 178.62 Cr. Cash flow from operating activities improved to 41.00 Cr in Mar'25, up from 16.00 Cr in Mar'24, indicating a positive cash flow trend despite the overall decline in profits.

View full answer

What is the technical trend for Kovil. Lak. Rol.?

09-Jun-2025

As of April 17, 2025, Kovil. Lak. Rol. shows a mildly bearish trend overall, influenced by daily moving averages and mixed signals from MACD and KST, despite some bullish indications on the weekly chart.

As of 17 April 2025, the technical trend for Kovil. Lak. Rol. has changed from bearish to mildly bearish. The weekly MACD indicates a mildly bullish stance, while the monthly MACD remains bearish. The daily moving averages are mildly bearish, suggesting short-term weakness. Bollinger Bands show a bullish signal on the weekly chart but are mildly bearish on the monthly chart. The KST is mildly bullish weekly but bearish monthly, and Dow Theory indicates no clear trend in both weekly and monthly time frames. Overall, the current stance is mildly bearish, driven primarily by the daily moving averages and the mixed signals from MACD and KST.

View full answer

Who are the top shareholders of the Kovil. Lak. Rol.?

06-Jun-2025

The top shareholder of Kovil. Lak. Rol. is Sharath Jagannathan, holding 23.75%, with no pledged promoter holdings. The highest public shareholder is Harish Kollangode Swaminathan at 1.71%, while individual investors collectively own 22.35% of the shares.

The top shareholders of Kovil. Lak. Rol. include the promoters, with Sharath Jagannathan holding the largest share at 23.75%. There are no pledged promoter holdings, and the company does not have any mutual funds or foreign institutional investors (FIIs) holding shares. The highest public shareholder is Harish Kollangode Swaminathan, who holds 1.71%. Additionally, individual investors collectively hold 22.35% of the company's shares.

View full answer

Has Kovil. Lak. Rol. declared dividend?

06-Jun-2025

Kovilpatti Lakshmi Roller Flour Mills Ltd has declared a 12% dividend, amounting to ₹1.2 per share, with an ex-date of September 2, 2024. Despite the dividend, recent total returns show significant volatility, with negative returns over shorter periods but substantial gains over the longer term.

Kovilpatti Lakshmi Roller Flour Mills Ltd has declared a 12% dividend.<BR><BR>Dividend Details:<BR>- Percentage announced: 12%<BR>- Amount per share: 1.2<BR>- Ex-date: 02 Sep 2024<BR><BR>Dividend Yield: 1.05%.<BR><BR>Total Returns by Period:<BR>In the last 6 months, the price return was -20.89%, the dividend return was 0%, resulting in a total return of -20.89%.<BR><BR>Over the past year, the price return was -37.55%, the dividend return was 0.61%, leading to a total return of -36.94%.<BR><BR>In the 2-year period, the price return was -15.56%, the dividend return was 2.44%, culminating in a total return of -13.12%.<BR><BR>For the 3-year period, the price return was 49.8%, the dividend return was 7.01%, resulting in a total return of 56.81%.<BR><BR>In the last 4 years, the price return was 71.56%, the dividend return was 9.56%, leading to a total return of 81.12%.<BR><BR>Over the past 5 years, the price return was 283.84%, the dividend return was 18.47%, resulting in a total return of 302.31%.<BR><BR>Overall, while Kovilpatti Lakshmi Roller Flour Mills Ltd has declared a dividend, the recent total returns indicate significant volatility, with negative returns over shorter periods but substantial gains over the longer term. The dividend yield remains modest, reflecting the company's performance amidst fluctuating price returns.

View full answer
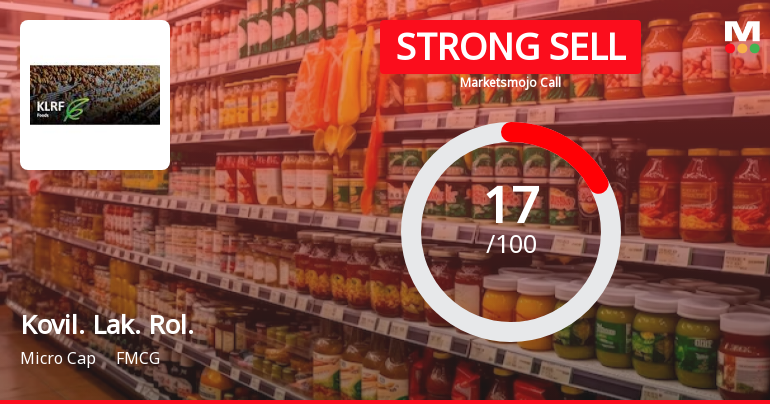
iScoreScore
Click here to find our call on this stock
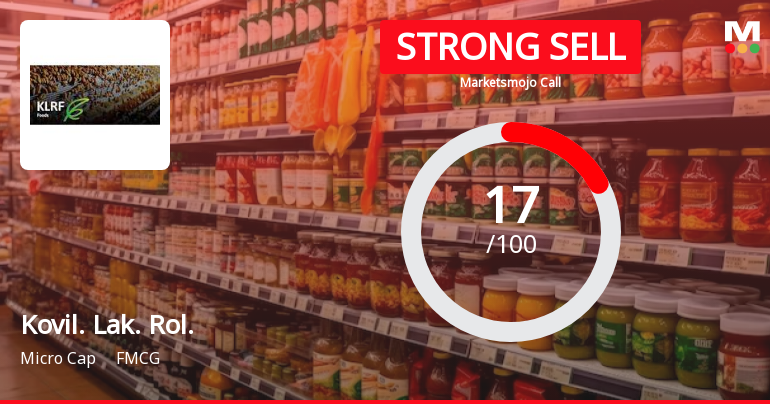
Strong Sell
Sell
Hold
Buy
Strong Buy

Dashboard

1

Weak Long Term Fundamental Strength with a 2.01% CAGR growth in Operating Profits over the last 5 years

  • Low ability to service debt as the company has a high Debt to EBITDA ratio of 4.16 times
2

Negative results in Jun 26

3

Consistent Underperformance against the benchmark over the last 3 years

stock-summaryMojo Parameters

Mojo Parameters

Loading Valuation Snapshot...

Stock DNA

stock-summary
Industry

FMCG

stock-summary
Market cap

INR 80 Cr (Micro Cap)

stock-summary
P/E

19.00

stock-summary
Industry P/E

44

stock-summary
Dividend Yield

1.71%

stock-summary
Debt Equity

1.09

stock-summary
Return on Equity

5.47%

stock-summary
Price to Book

1.06

Revenue and Profits:
Net Sales:
92 Cr
(Quarterly Results - Jun 2026)
Net Profit:
1 Cr
stock-summaryTotal Returns
Total Returns (Price + Dividend) stock-summary
Dividend Yield (1.71%)
TimePeriod
Price Return
Dividend Return
Total Return
3 Months
-13.41%
0.99%
-12.42%
6 Months
-15.28%
0.98%
-14.3%
1 Year
-31.7%
0.77%
-30.93%
2 Years
-53.4%
0.83%
-52.57%
3 Years
-40.32%
2.81%
-37.51%
4 Years
-19.92%
4.52%
-15.4%
5 Years
25.73%
9.38%
35.11%

Latest dividend: 0.9998857142857143 per share ex-dividend date: Sep-02-2026

Risk Adjusted Returns v/s stock-summary
Returns Beta
Icon
Beta has not been calculated since enough price history is not available
stock-summaryNews & Corporate Actions

Announcements stock-summary

Submission Of News Paper Advertisement-Unaudited Financial Results 30-06-2026.

15-Aug-2026 | Source : BSE

With reference to the above we enclose a copies of the advertisement published in Daily Thanthi (Tamil) and Business Line (English)

Announcement under Regulation 30 (LODR)-Newspaper Publication

14-Aug-2026 | Source : BSE

With reference to the above we enclose a paper advertisement published in Tamil Daily Thanthi and English Busienss Line dated 14th August 2026 for post despatch of notice to shareholders convening 64th Annual General Meeting on Wednesday 9th September 2026 @ 09:15 AM.

Intimation About Cessation Of Sri. Jegan Adhinarayanan And Sri. S. Ramachandran As Senior Management Personnel Due The Change In Their Roles And Responsibilities Within The Company With Effect From 14-08-2026.

14-Aug-2026 | Source : BSE

With reference to the above we would like to inform you that cessation of Sri.Jegan Adinarayanan and Sri. S. Ramachandran as Senior Management Personnel due to change in their roles and responsibilities within the company with effect from 14-08-2026. The disclosure as required under Regulation 30 read with Schedule III of the Listing Regulations are in Annexure A.

Corporate Actions stock-summary

stock-summary
BOARD MEETING

No Upcoming Board Meetings

stock-summary
DIVIDEND

Kovilpatti Lakshmi Roller Flour Mills Ltd has declared 10% dividend, ex-date: 02 Sep 26

stock-summary
SPLITS

No Splits history available

stock-summary
BONUS

No Bonus history available

stock-summary
RIGHTS

No Rights history available

stock-summaryKey Factors

Quality key factors stock-summary

Factor
Value
Sales Growth (5y)
11.15%
EBIT Growth (5y)
2.01%
EBIT to Interest (avg)
2.45
Debt to EBITDA (avg)
3.48
Net Debt to Equity (avg)
1.09
Sales to Capital Employed (avg)
2.89
Tax Ratio
20.26%
Dividend Payout Ratio
39.25%
Pledged Shares
0
Institutional Holding
0.00%
ROCE (avg)
14.02%
ROE (avg)
11.55%

Valuation key factors

Factor
Value
P/E Ratio
19
Industry P/E
44
Price to Book Value
1.06
EV to EBIT
13.68
EV to EBITDA
8.53
EV to Capital Employed
1.03
EV to Sales
0.40
PEG Ratio
NA
Dividend Yield
1.71%
ROCE (Latest)
7.98%
ROE (Latest)
5.47%

Technicals key factors

Indicator
Weekly
Monthly
MACD
Bearish
Bearish
RSI
No Signal
No Signal
Bollinger Bands
Bearish
Bearish
Moving Averages
Bearish (Daily)
KST
Bearish
Mildly Bullish
Dow Theory
Mildly Bearish
No Trend
stock-summary Technical Indicator Scale: Bearish, Mildly Bearish, Sideways, Mildly Bullish, Bullish  Turned 
stock-summaryShareholding
Shareholding Snapshot : Jun 2026stock-summary
Shareholding Compare (%holding) stock-summary
Majority shareholders

Promoters

Pledged Promoter Holdings

None

Mutual Funds

Held by 0 Schemes

FIIs

Held by 0 FIIs

Promoter with highest holding

Sharath Jagannathan (23.75%)

Highest Public shareholder

Harish Kollangode Swaminathan (1.71%)

Individual Investors Holdings

21.99%

stock-summaryFinancial
[
  {
    "link": "quarterly",
    "btn_text": "All Quarterly Results",
    "header": "Quarterly Results Snapshot (Standalone) - Jun'26 - QoQ",
    "rhs": [
      {
        "prefix": "Net Sales ",
        "suffix": "QoQ Growth in quarter ended Jun 2026 is -7.60% vs -7.16% in Mar 2026",
        "dir": -1
      },
      {
        "prefix": "Standalone Net Profit ",
        "suffix": "QoQ Growth in quarter ended Jun 2026 is -63.55% vs 315.28% in Mar 2026",
        "dir": -1
      }
    ],
    "table": {
      "header": [
        "Jun'26",
        "Mar'26",
        "Change(%)"
      ],
      "body": [
        {
          "field": "Net Sales",
          "val1": "92.27",
          "val2": "99.86",
          "chgp": "-7.60%",
          "chgp_class": "negative"
        },
        {
          "field": "Operating Profit (PBDIT) excl Other Income",
          "val1": "4.51",
          "val2": "4.65",
          "chgp": "-3.01%",
          "chgp_class": "negative"
        },
        {
          "field": "Interest",
          "val1": "1.78",
          "val2": "1.82",
          "chgp": "-2.20%",
          "chgp_class": "positive"
        },
        {
          "field": "Exceptional Items",
          "val1": "0.00",
          "val2": "1.66",
          "chgp": "-100.00%",
          "chgp_class": "negative"
        },
        {
          "field": "Standalone Net Profit",
          "val1": "1.09",
          "val2": "2.99",
          "chgp": "-63.55%",
          "chgp_class": "negative"
        },
        {
          "field": "Operating Profit Margin (Excl OI)",
          "val1": "4.89%",
          "val2": "4.66%",
          "chgp": "0.23%",
          "chgp_class": "positive"
        }
      ]
    }
  },
  {
    "link": "half-yearly",
    "btn_text": "All Half Yearly Results",
    "header": "Half Yearly Results Snapshot (Standalone) - Sep'25",
    "rhs": [
      {
        "prefix": "Net Sales ",
        "suffix": " Growth in half year ended Sep 2025 is -3.07% vs 23.28% in Sep 2024",
        "dir": -1
      },
      {
        "prefix": "Standalone Net Profit ",
        "suffix": " Growth in half year ended Sep 2025 is 250.86% vs -145.68% in Sep 2024",
        "dir": 1
      }
    ],
    "table": {
      "header": [
        "Sep'25",
        "Sep'24",
        "Change(%)"
      ],
      "body": [
        {
          "field": "Net Sales",
          "val1": "203.44",
          "val2": "209.89",
          "chgp": "-3.07%",
          "chgp_class": "negative"
        },
        {
          "field": "Operating Profit (PBDIT) excl Other Income",
          "val1": "10.28",
          "val2": "2.77",
          "chgp": "271.12%",
          "chgp_class": "positive"
        },
        {
          "field": "Interest",
          "val1": "4.75",
          "val2": "4.59",
          "chgp": "3.49%",
          "chgp_class": "negative"
        },
        {
          "field": "Exceptional Items",
          "val1": "2.95",
          "val2": "0.00",
          "chgp": "",
          "chgp_class": "neutral"
        },
        {
          "field": "Standalone Net Profit",
          "val1": "4.39",
          "val2": "-2.91",
          "chgp": "250.86%",
          "chgp_class": "positive"
        },
        {
          "field": "Operating Profit Margin (Excl OI)",
          "val1": "5.05%",
          "val2": "1.32%",
          "chgp": "3.73%",
          "chgp_class": "positive"
        }
      ]
    }
  },
  {
    "link": "nine-monthly",
    "btn_text": "All Nine Monthly Results",
    "header": "Nine Monthly Results Snapshot (Standalone) - Dec'25",
    "rhs": [
      {
        "prefix": "Net Sales ",
        "suffix": "YoY Growth in nine months ended Dec 2025 is -2.34% vs 16.27% in Dec 2024",
        "dir": -1
      },
      {
        "prefix": "Standalone Net Profit ",
        "suffix": "YoY Growth in nine months ended Dec 2025 is 552.21% vs -114.00% in Dec 2024",
        "dir": 1
      }
    ],
    "table": {
      "header": [
        "Dec'25",
        "Dec'24",
        "Change(%)"
      ],
      "body": [
        {
          "field": "Net Sales",
          "val1": "311.00",
          "val2": "318.46",
          "chgp": "-2.34%",
          "chgp_class": "negative"
        },
        {
          "field": "Operating Profit (PBDIT) excl Other Income",
          "val1": "15.02",
          "val2": "8.89",
          "chgp": "68.95%",
          "chgp_class": "positive"
        },
        {
          "field": "Interest",
          "val1": "7.21",
          "val2": "6.89",
          "chgp": "4.64%",
          "chgp_class": "negative"
        },
        {
          "field": "Exceptional Items",
          "val1": "2.95",
          "val2": "0.00",
          "chgp": "",
          "chgp_class": "neutral"
        },
        {
          "field": "Standalone Net Profit",
          "val1": "5.11",
          "val2": "-1.13",
          "chgp": "552.21%",
          "chgp_class": "positive"
        },
        {
          "field": "Operating Profit Margin (Excl OI)",
          "val1": "4.83%",
          "val2": "2.79%",
          "chgp": "2.04%",
          "chgp_class": "positive"
        }
      ]
    }
  },
  {
    "link": "annual",
    "btn_text": "All Annual Results",
    "header": "Annual Results Snapshot (Standalone) - Mar'26",
    "rhs": [
      {
        "prefix": "Net Sales ",
        "suffix": "YoY Growth in year ended Mar 2026 is -3.69% vs 3.82% in Mar 2025",
        "dir": -1
      },
      {
        "prefix": "Standalone Net Profit ",
        "suffix": "YoY Growth in year ended Mar 2026 is 603.48% vs -85.26% in Mar 2025",
        "dir": 1
      }
    ],
    "table": {
      "header": [
        "Mar'26",
        "Mar'25",
        "Change(%)"
      ],
      "body": [
        {
          "field": "Net Sales",
          "val1": "410.86",
          "val2": "426.59",
          "chgp": "-3.69%",
          "chgp_class": "negative"
        },
        {
          "field": "Operating Profit (PBDIT) excl Other Income",
          "val1": "19.66",
          "val2": "14.68",
          "chgp": "33.92%",
          "chgp_class": "positive"
        },
        {
          "field": "Interest",
          "val1": "9.03",
          "val2": "8.54",
          "chgp": "5.74%",
          "chgp_class": "negative"
        },
        {
          "field": "Exceptional Items",
          "val1": "4.60",
          "val2": "0.00",
          "chgp": "",
          "chgp_class": "neutral"
        },
        {
          "field": "Standalone Net Profit",
          "val1": "8.09",
          "val2": "1.15",
          "chgp": "603.48%",
          "chgp_class": "positive"
        },
        {
          "field": "Operating Profit Margin (Excl OI)",
          "val1": "4.79%",
          "val2": "3.44%",
          "chgp": "1.35%",
          "chgp_class": "positive"
        }
      ]
    }
  }
]

Quarterly Results Snapshot (Standalone) - Jun'26 - QoQstock-summary

Jun'26
Mar'26
Change(%)
Net Sales
92.27
99.86
-7.60%
Operating Profit (PBDIT) excl Other Income
4.51
4.65
-3.01%
Interest
1.78
1.82
-2.20%
Exceptional Items
0.00
1.66
-100.00%
Standalone Net Profit
1.09
2.99
-63.55%
Operating Profit Margin (Excl OI)
4.89%
4.66%
0.23%
Values in Rs Cr.
Direction Arrows
Net Sales

QoQ Growth in quarter ended Jun 2026 is -7.60% vs -7.16% in Mar 2026

Direction Arrows
Standalone Net Profit

QoQ Growth in quarter ended Jun 2026 is -63.55% vs 315.28% in Mar 2026

Half Yearly Results Snapshot (Standalone) - Sep'25stock-summary

Sep'25
Sep'24
Change(%)
Net Sales
203.44
209.89
-3.07%
Operating Profit (PBDIT) excl Other Income
10.28
2.77
271.12%
Interest
4.75
4.59
3.49%
Exceptional Items
2.95
0.00
Standalone Net Profit
4.39
-2.91
250.86%
Operating Profit Margin (Excl OI)
5.05%
1.32%
3.73%
Values in Rs Cr.
Direction Arrows
Net Sales

Growth in half year ended Sep 2025 is -3.07% vs 23.28% in Sep 2024

Direction Arrows
Standalone Net Profit

Growth in half year ended Sep 2025 is 250.86% vs -145.68% in Sep 2024

Nine Monthly Results Snapshot (Standalone) - Dec'25stock-summary

Dec'25
Dec'24
Change(%)
Net Sales
311.00
318.46
-2.34%
Operating Profit (PBDIT) excl Other Income
15.02
8.89
68.95%
Interest
7.21
6.89
4.64%
Exceptional Items
2.95
0.00
Standalone Net Profit
5.11
-1.13
552.21%
Operating Profit Margin (Excl OI)
4.83%
2.79%
2.04%
Values in Rs Cr.
Direction Arrows
Net Sales

YoY Growth in nine months ended Dec 2025 is -2.34% vs 16.27% in Dec 2024

Direction Arrows
Standalone Net Profit

YoY Growth in nine months ended Dec 2025 is 552.21% vs -114.00% in Dec 2024

Annual Results Snapshot (Standalone) - Mar'26stock-summary

Mar'26
Mar'25
Change(%)
Net Sales
410.86
426.59
-3.69%
Operating Profit (PBDIT) excl Other Income
19.66
14.68
33.92%
Interest
9.03
8.54
5.74%
Exceptional Items
4.60
0.00
Standalone Net Profit
8.09
1.15
603.48%
Operating Profit Margin (Excl OI)
4.79%
3.44%
1.35%
Values in Rs Cr.
Direction Arrows
Net Sales

YoY Growth in year ended Mar 2026 is -3.69% vs 3.82% in Mar 2025

Direction Arrows
Standalone Net Profit

YoY Growth in year ended Mar 2026 is 603.48% vs -85.26% in Mar 2025

stock-summaryCompany CV
About Kovilpatti Lakshmi Roller Flour Mills Ltd stock-summary
stock-summary
Kovilpatti Lakshmi Roller Flour Mills Ltd
Micro Cap
FMCG
Kovilpatti Lakshmi Roller Flour Mills Limited was established on December 16, 1964 with an initial milling capacity of 15,600 MT per annum and has since expanded to 74,900 MT per annum. On account of amalgamation, the production capacity has been additionally increased by 96,300 MT. The wheat products are marketed in varied SKUs across Tamilnadu and Kerala.
Company Coordinates stock-summary
Company Details
75/8 Benares Cape Road , Gangaikondan Tamil Nadu : 627352
stock-summary
Tel: 91-0462-2486532
stock-summary
ho@klrf.in
Registrar Details
Link Intime India Pvt Ltd, Coimbatore Branch Surya , 35 Mayflower Avenue, Behind Senthil Nagar, Sowripalayam Road, Coimbatore