
Compare Kovil. Lak. Rol. with Similar Stocks
Total Returns (Price + Dividend) 
Latest dividend: 0.5 per share ex-dividend date: Sep-03-2025
Risk Adjusted Returns v/s
Returns Beta

News
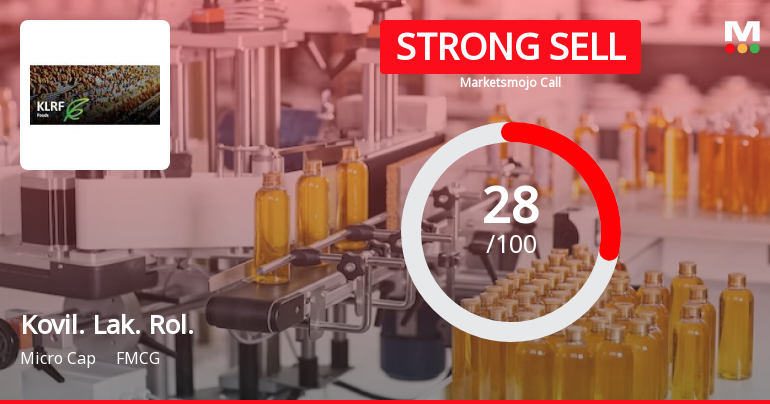
Kovilpatti Lakshmi Roller Flour Mills Ltd is Rated Strong Sell
Kovilpatti Lakshmi Roller Flour Mills Ltd is rated Strong Sell by MarketsMOJO. This rating was last updated on 12 May 2026, reflecting a change from the previous 'Sell' grade. However, all fundamentals, returns, and financial metrics discussed here are current as of 04 June 2026, providing investors with the latest insight into the stock's position.
Read full news articleAre Kovilpatti Lakshmi Roller Flour Mills Ltd latest results good or bad?
Kovilpatti Lakshmi Roller Flour Mills Ltd's latest financial results for the quarter ended March 2026 present a mixed picture. The company reported a net profit of ₹2.99 crore, reflecting a significant sequential improvement of 315.28% compared to the previous quarter. This recovery in net profit is notable, especially as it contrasts with the company's revenue performance, which saw a decline. Revenue for the same quarter was ₹99.86 crore, marking a decrease of 7.16% quarter-on-quarter and 7.65% year-on-year. The operating margin for the quarter stood at 4.66%, which indicates a decline from the previous year's margin of 5.36%. This compression in operating margins raises concerns about the company's ability to manage costs effectively in a competitive environment. Additionally, the company's return on equity (ROE) and return on capital employed (ROCE) metrics have shown a concerning deterioration, with ...
Read full news article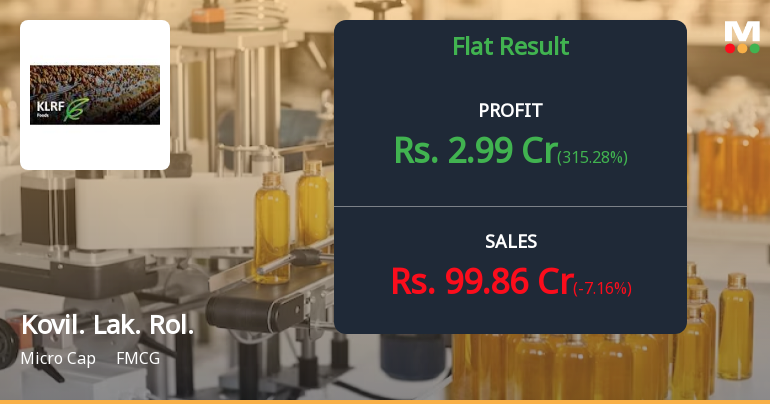
Kovilpatti Lakshmi Roller Flour Mills Q4 FY26: Profit Recovery Masks Persistent Margin Erosion
Kovilpatti Lakshmi Roller Flour Mills Ltd. (KLRF), a micro-cap FMCG company specialising in flour milling and textile manufacturing, reported a net profit of ₹2.99 crores for Q4 FY26, marking a substantial recovery of 315.28% quarter-on-quarter from ₹0.72 crores in Q3 FY26. However, this sequential improvement masks deeper structural concerns, as the year-on-year comparison reveals a more modest gain of 43.75% from ₹2.08 crores in Q4 FY25. With a market capitalisation of ₹94.00 crores and shares trading at ₹102.00 following a 2.67% decline, the stock continues to struggle against persistent margin pressures and operational headwinds that have defined the company's recent financial trajectory.
Read full news article Announcements
Announcement under Regulation 30 (LODR)-Newspaper Publication
30-May-2026 | Source : BSEWith reference to the above we enclose copies of our Audited Financial REsult for the quarter and year ended 31st March 2026 published in English viz. Business Line and Daily Thanthi on 30th May 2026
Submission Presentation Prepared For Q4 FY 2025-26 - Reg
30-May-2026 | Source : BSEWe hereby volunatrily submit the presentation prepared by the company for Q4 FY 2025-26 for the general information of all the shareholders. The said presentation is also available on the companys website www.klrf.in We would like to inform you that the above presentation is being submitted volunatrily for wider dissemination of information to the shareholders and no analysists or investors meeting earnings call conference call group meetings or any other discussion or interaction with any investor is proposed to be conducted in connection with the above presentation. This is for your information and record
Corporate Action-Board to consider Dividend
29-May-2026 | Source : BSEBoard has recommended 10% ie. Rs.1 per equity share subject to approval of the shareholders at the ensuing annual general meeting
Corporate Actions

No Upcoming Board Meetings

Kovilpatti Lakshmi Roller Flour Mills Ltd has declared 5% dividend, ex-date: 03 Sep 25

No Splits history available

No Bonus history available

No Rights history available
Quality key factors
Valuation key factors
Technicals key factors
 Technical Indicator Scale: Bearish, Mildly Bearish, Sideways, Mildly Bullish, Bullish Turned
 Shareholding Snapshot : Mar 2026
Shareholding Compare (%holding)
Promoters
None
Held by 0 Schemes
Held by 0 FIIs
Sharath Jagannathan (23.75%)
Harish Kollangode Swaminathan (1.71%)
22.27%
Quarterly Results Snapshot (Standalone) - Mar'26 - QoQ

QoQ Growth in quarter ended Mar 2026 is -7.16% vs 3.57% in Dec 2025

QoQ Growth in quarter ended Mar 2026 is 315.28% vs -4.00% in Dec 2025
Half Yearly Results Snapshot (Standalone) - Sep'25
Growth in half year ended Sep 2025 is -3.07% vs 23.28% in Sep 2024
Growth in half year ended Sep 2025 is 250.86% vs -145.68% in Sep 2024
Nine Monthly Results Snapshot (Standalone) - Dec'25
YoY Growth in nine months ended Dec 2025 is -2.34% vs 16.27% in Dec 2024
YoY Growth in nine months ended Dec 2025 is 552.21% vs -114.00% in Dec 2024
Annual Results Snapshot (Standalone) - Mar'26
YoY Growth in year ended Mar 2026 is -3.69% vs 3.82% in Mar 2025
YoY Growth in year ended Mar 2026 is 603.48% vs -85.26% in Mar 2025
About Kovilpatti Lakshmi Roller Flour Mills Ltd

Company Coordinates


