
Compare KPIT Technologi. with Similar Stocks
Dashboard
Negative results in Mar 26
- INTEREST(Latest six months) At Rs 45.39 cr has Grown at 60.50%
- PAT(Latest six months) At Rs 340.35 cr has Grown at -21.16%
- ROCE(HY) Lowest at 22.96%
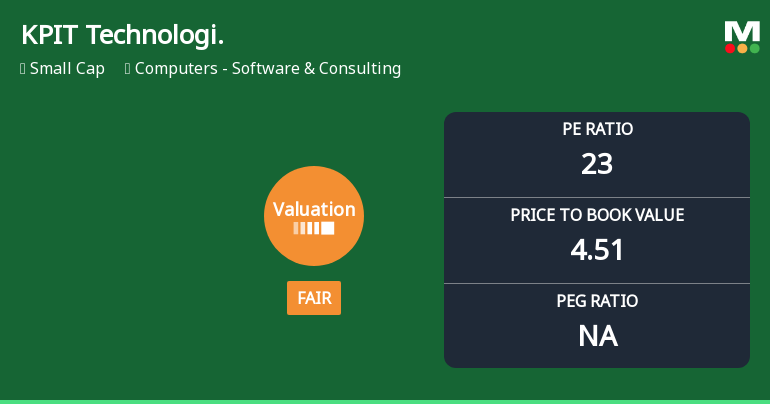
With ROE of 19.2, it has a Expensive valuation with a 4.7 Price to Book Value
Reducing Promoter Confidence
Below par performance in long term as well as near term
Stock DNA
Computers - Software & Consulting
INR 17,246 Cr (Small Cap)
24.00
21
1.36%
-0.16
19.24%
4.66
Total Returns (Price + Dividend) 
Latest dividend: 2.2 per share ex-dividend date: Feb-04-2026
Risk Adjusted Returns v/s
Returns Beta

News
KPIT Technologies Ltd Valuation Shifts Signal Changing Market Sentiment
KPIT Technologies Ltd has experienced a notable shift in its valuation parameters, moving from an attractive to a fair rating. This change reflects evolving market perceptions amid a challenging price environment and a comparative analysis against industry peers, highlighting the stock’s current price attractiveness and investment appeal.
Read full news article
KPIT Technologies Ltd is Rated Sell
KPIT Technologies Ltd is rated 'Sell' by MarketsMOJO, with this rating last updated on 06 May 2026. However, the analysis and financial metrics discussed here reflect the stock's current position as of 26 July 2026, providing investors with an up-to-date view of the company’s fundamentals, returns, and market performance.
Read full news article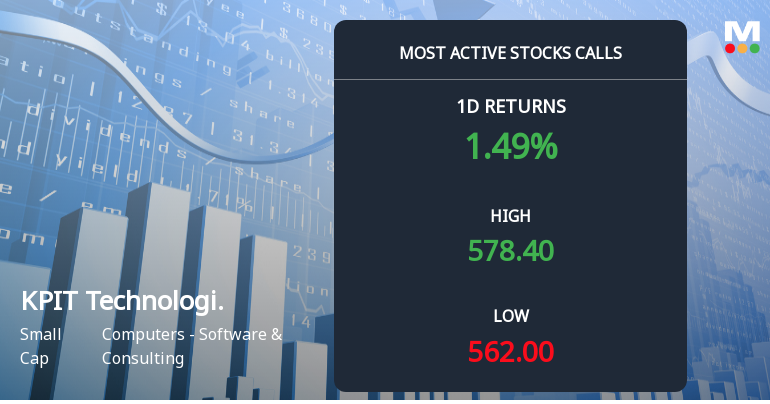
5,897 Call Contracts Traded on KPIT Technologies Ltd as Stock Gains 3.96% in Three-Day Rally
On 21 Jul 2026, 5,897 call contracts on KPIT Technologies Ltd changed hands at the Rs 580 strike price, with the stock closing at Rs 571.30 after a 1.42% gain. This surge in call activity coincides with a three-day rally that has lifted the stock by nearly 4%, signalling a growing directional interest in the near term.
Read full news article Announcements
Announcement under Regulation 30 (LODR)-Analyst / Investor Meet - Intimation
24-Jul-2026 | Source : BSEPost Earnings Conference Call of the Company is scheduled on Wednesday July 29 2026 at 17:30 Hrs. (IST). The details of the said call are enclosed
Board Meeting Intimation for Intimation Of Meeting Of Board Of Directors
17-Jul-2026 | Source : BSEKPIT Technologies Ltdhas informed BSE that the meeting of the Board of Directors of the Company is scheduled on 29/07/2026 inter alia to consider and approve The Un-audited financial results of the Company along with the Limited Review Report for the quarter ended June 30 2026.
Compliances-Certificate under Reg. 74 (5) of SEBI (DP) Regulations 2018
14-Jul-2026 | Source : BSEPlease find enclosed herewith the certificate under Regulation 74 (5) of SEBI DP Regulations 2018 for the quarter ended June 30 2026.
Corporate Actions

(29 Jul 2026)

KPIT Technologies Ltd has declared 22% dividend, ex-date: 04 Feb 26

No Splits history available

No Bonus history available

No Rights history available
Quality key factors
Valuation key factors
Technicals key factors
 Technical Indicator Scale: Bearish, Mildly Bearish, Sideways, Mildly Bullish, Bullish Turned
 Shareholding Snapshot : Jun 2026
Shareholding Compare (%holding)
Promoters
None
Held by 30 Schemes (11.91%)
Held by 224 FIIs (13.22%)
Proficient Finstock Llp (32.41%)
Life Insurance Corporation Of India (4.39%)
19.83%
Quarterly Results Snapshot (Consolidated) - Mar'26 - QoQ

QoQ Growth in quarter ended Mar 2026 is 5.78% vs 1.87% in Dec 2025
QoQ Growth in quarter ended Mar 2026 is 22.32% vs -21.17% in Dec 2025
Half Yearly Results Snapshot (Consolidated) - Sep'25

Growth in half year ended Sep 2025 is 10.24% vs 23.48% in Sep 2024
Growth in half year ended Sep 2025 is -16.41% vs 48.41% in Sep 2024
Nine Monthly Results Snapshot (Consolidated) - Dec'25
YoY Growth in nine months ended Dec 2025 is 9.97% vs 21.39% in Dec 2024
YoY Growth in nine months ended Dec 2025 is -20.27% vs 38.29% in Dec 2024
Annual Results Snapshot (Consolidated) - Mar'26
YoY Growth in year ended Mar 2026 is 10.49% vs 19.93% in Mar 2025
YoY Growth in year ended Mar 2026 is -24.09% vs 41.22% in Mar 2025
About KPIT Technologies Ltd

Company Coordinates


