
Compare Kranti Industrie with Similar Stocks
Dashboard
Weak Long Term Fundamental Strength with an average Return on Capital Employed (ROCE) of 5.29%
- Poor long term growth as Net Sales has grown by an annual rate of 12.31% over the last 5 years
- Low ability to service debt as the company has a high Debt to EBITDA ratio of 4.07 times
Flat results in Mar 26
Underperformed the market in the last 1 year
Stock DNA
Auto Components & Equipments
INR 82 Cr (Micro Cap)
35.00
37
0.00%
1.08
5.21%
1.86
Total Returns (Price + Dividend) 
Kranti Industrie for the last several years.
Risk Adjusted Returns v/s
Returns Beta

News
Kranti Industries Ltd is Rated Strong Sell
Kranti Industries Ltd is rated Strong Sell by MarketsMOJO, with this rating last updated on 30 May 2026. However, the analysis and financial metrics discussed here reflect the stock’s current position as of 17 June 2026, providing investors with the latest insights into the company’s performance and outlook.
Read full news article
Kranti Industries Ltd is Rated Strong Sell
Kranti Industries Ltd is rated Strong Sell by MarketsMOJO, with this rating last updated on 30 May 2026. However, the analysis and financial metrics discussed here reflect the stock’s current position as of 08 June 2026, providing investors with the latest insights into the company’s performance and outlook.
Read full news article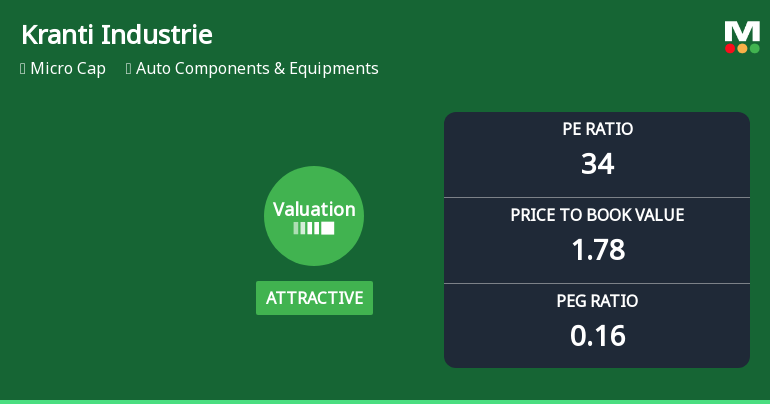
Kranti Industries Ltd Valuation Shifts Signal Renewed Price Attractiveness Amid Market Pressures
Kranti Industries Ltd, a micro-cap player in the Auto Components & Equipments sector, has seen a notable shift in its valuation parameters, moving from a fair to an attractive rating despite ongoing market headwinds and a significant share price decline. This article analyses the recent changes in key valuation metrics, compares them with peer averages and historical benchmarks, and assesses the implications for investors amid a challenging operating environment.
Read full news article Announcements
Board Meeting Outcome for Board Meeting Outcome For Availment Of Additional Working Capital Term Loan Facility From HDFC Bank Ltd Under Emergency Credit Line Guaranteed Scheme (ECLGS)
13-Jun-2026 | Source : BSEPursuant to Regulation 30 read with Schedule III of the SEBI (Listing Obligations and Disclosure Requirements) Regulations 2015 the Board of Directors of the Company at their meeting held today i.e. June 13 2026 have considered and approved the Availment of additional Working Capital Term Loan Facility from HDFC Bank Ltd Under Emergency Credit Line Guaranteed Scheme (ECLGS). Kindly take the same on your record.
Announcement under Regulation 30 (LODR)-Earnings Call Transcript
04-Jun-2026 | Source : BSEPursuant to Regulation 30 read with Regulation 46 of SEBI (Listing Obligations and Disclosure Requirements) Regulations 2015 we enclosed herewith the transcript of Earnings Conference Call held with Analyst/Institutional Investors held on Tuesday June 02 2026. Kindly take the note of the same.
Announcement under Regulation 30 (LODR)-Analyst / Investor Meet - Outcome
02-Jun-2026 | Source : BSEPursuant to Regulation 30 and Regulation 46 the SEBI (Listing Obligations and Disclosure Requirements) Regulations 2015 we wish to inform you that the Company has concluded its Earnings Conference Call with various Analysts and Institutional Investors today i.e. Tuesday June 02 2026 at 04:30 PM (IST) in connection with the Audited (Standalone & Consolidated) Financial Results of the Company for the Q4 & Financial Year ended on March 31 2026. Kindly take the above information in your record.
Corporate Actions

No Upcoming Board Meetings

No Dividend history available

No Splits history available

Kranti Industries Ltd has announced 1:5 bonus issue, ex-date: 15 Jun 21

No Rights history available
Quality key factors
Valuation key factors
Technicals key factors
 Technical Indicator Scale: Bearish, Mildly Bearish, Sideways, Mildly Bullish, Bullish Turned
 Shareholding Snapshot : Mar 2026
Shareholding Compare (%holding)
Promoters
None
Held by 0 Schemes
Held by 0 FIIs
Vora Indubala Subhash (19.14%)
Evolution Capital Advisory Services Private Limited (9.8%)
25.28%
Quarterly Results Snapshot (Consolidated) - Mar'26 - QoQ

QoQ Growth in quarter ended Mar 2026 is 20.87% vs 7.99% in Dec 2025
QoQ Growth in quarter ended Mar 2026 is -63.64% vs -72.95% in Dec 2025
Half Yearly Results Snapshot (Consolidated) - Sep'25
Growth in half year ended Sep 2025 is 14.63% vs -17.01% in Sep 2024
Growth in half year ended Sep 2025 is 269.72% vs -223.86% in Sep 2024
Nine Monthly Results Snapshot (Consolidated) - Dec'25
YoY Growth in nine months ended Dec 2025 is 21.79% vs -16.23% in Dec 2024
YoY Growth in nine months ended Dec 2025 is 202.83% vs -1,347.06% in Dec 2024
Annual Results Snapshot (Consolidated) - Mar'26
YoY Growth in year ended Mar 2026 is 27.98% vs -13.07% in Mar 2025
YoY Growth in year ended Mar 2026 is 212.25% vs -484.91% in Mar 2025
About Kranti Industries Ltd

Company Coordinates


