
Compare Krebs Biochem with Similar Stocks
Dashboard
With a Negative Book Value, the company has a Weak Long Term Fundamental Strength
- Poor long term growth as Net Sales has grown by an annual rate of -15.07% and Operating profit at 0% over the last 5 years
- The company has a negative book value of Rs 162.76 crore
The company has declared Negative results for the last 6 consecutive quarters
Risky - Negative EBITDA
Underperformed the market in the last 1 year
Stock DNA
Pharmaceuticals & Biotechnology
INR 139 Cr (Micro Cap)
NA (Loss Making)
34
0.00%
-1.38
10.40%
-0.85
Total Returns (Price + Dividend) 
Krebs Biochem for the last several years.
Risk Adjusted Returns v/s
Returns Beta

News
Krebs Biochemicals & Industries Ltd is Rated Strong Sell
Krebs Biochemicals & Industries Ltd is rated Strong Sell by MarketsMOJO. This rating was last updated on 06 February 2025. However, the analysis and financial metrics presented here reflect the company’s current position as of 15 June 2026, providing investors with an up-to-date view of the stock’s fundamentals, valuation, financial trends, and technical outlook.
Read full news article
Krebs Biochemicals & Industries Ltd is Rated Strong Sell
Krebs Biochemicals & Industries Ltd is rated Strong Sell by MarketsMOJO. This rating was last updated on 06 February 2025, reflecting a significant reassessment of the stock’s outlook. However, the analysis and financial metrics presented here are based on the company’s current position as of 01 June 2026, providing investors with the latest insights into its performance and prospects.
Read full news article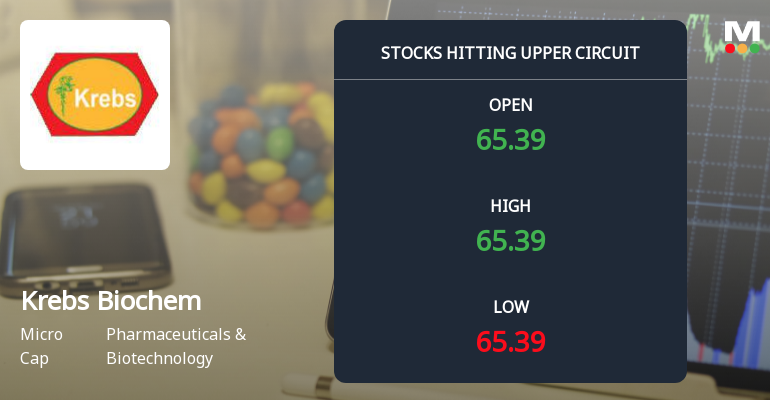
Krebs Biochemicals & Industries Ltd Locks at Upper Circuit With 4.78% Gain — Buyers Queue, Sellers Absent
At Rs 68.14, the buying was done — not because demand dried up, but because the exchange wouldn't let the stock go any higher. Krebs Biochemicals & Industries Ltd locked at its upper circuit of 4.78% on 27 May 2026, with buyers queuing and no sellers willing to part with shares.
Read full news article Announcements
Compliances-Reg.24(A)-Annual Secretarial Compliance
29-May-2026 | Source : BSEThe Company has enclosed herewith Annual Secretarial Complince Report for the yaer ended 31.03.2026.
Announcement under Regulation 30 (LODR)-Newspaper Publication
22-May-2026 | Source : BSEThe Company has enclosing herewith copy of newspapers advetiement of financial resulst for the quarter and yaer ended 31.03.2026.
Result For FY Ended 31.03.2026
21-May-2026 | Source : BSEAudited Results for fiancial yaer ended 31.03.2026
Corporate Actions

No Upcoming Board Meetings

No Dividend history available

No Splits history available

No Bonus history available

Krebs Biochemicals & Industries Ltd has announced 21:100 rights issue, ex-date: 31 Jan 19
Quality key factors
Valuation key factors
Technicals key factors
 Technical Indicator Scale: Bearish, Mildly Bearish, Sideways, Mildly Bullish, Bullish Turned
 Shareholding Snapshot : Mar 2026
Shareholding Compare (%holding)
Promoters
None
Held by 0 Schemes
Held by 2 FIIs (0.49%)
Ipca Laboratories Limited (49.65%)
Sun Pharmaceutical Industries Ltd (4.81%)
19.81%
Quarterly Results Snapshot (Standalone) - Mar'26 - YoY

YoY Growth in quarter ended Mar 2026 is 11.64% vs -49.04% in Mar 2025
YoY Growth in quarter ended Mar 2026 is 71.70% vs -41.37% in Mar 2025
Half Yearly Results Snapshot (Standalone) - Sep'25

Growth in half year ended Sep 2025 is -62.51% vs 1.06% in Sep 2024
Growth in half year ended Sep 2025 is -4.94% vs -22.81% in Sep 2024
Nine Monthly Results Snapshot (Standalone) - Dec'25
YoY Growth in nine months ended Dec 2025 is -54.53% vs -3.22% in Dec 2024
YoY Growth in nine months ended Dec 2025 is 21.80% vs -34.51% in Dec 2024
Annual Results Snapshot (Standalone) - Mar'26
YoY Growth in year ended Mar 2026 is -45.21% vs -14.10% in Mar 2025
YoY Growth in year ended Mar 2026 is 37.16% vs -36.54% in Mar 2025
About Krebs Biochemicals & Industries Ltd

Company Coordinates


