
Compare Kreon Finnancial with Similar Stocks
Dashboard
With a Operating Losses, the company has a Weak Long Term Fundamental Strength
The company has declared Positive results for the last 5 consecutive quarters
With ROE of 19.9, it has a Expensive valuation with a 4.4 Price to Book Value
Majority shareholders : Promoters
Market Beating Performance
Stock DNA
Non Banking Financial Company (NBFC)
INR 160 Cr (Micro Cap)
22.00
21
0.00%
0.79
19.86%
4.61
Total Returns (Price + Dividend) 
Kreon Finnancial for the last several years.
Risk Adjusted Returns v/s
Returns Beta

News

Kreon Finnancial Services Ltd is Rated Hold
Kreon Finnancial Services Ltd is rated 'Hold' by MarketsMOJO, with this rating last updated on 12 June 2026. However, the analysis and financial metrics discussed here reflect the stock's current position as of 18 July 2026, providing investors with an up-to-date view of the company's performance and outlook.
Read full news article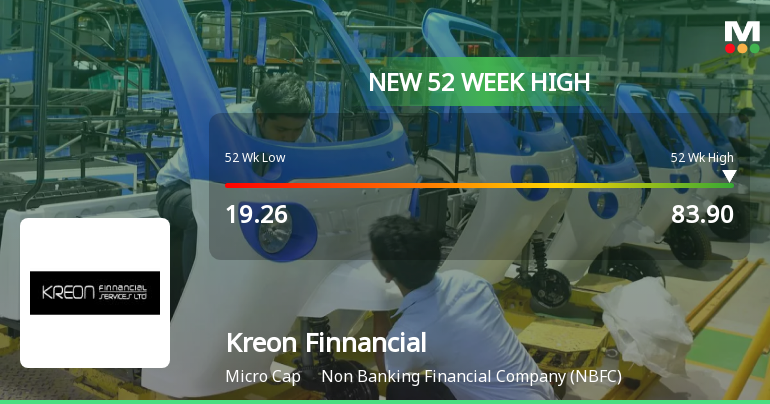
Broad-Based Technical Strength Lifts Kreon Finnancial Services Ltd to 52-Week High of Rs 83.9
Surging to a fresh 52-week high of Rs 83.9 on 16 Jul 2026, Kreon Finnancial Services Ltd has demonstrated remarkable price momentum, outperforming its sector and the broader market with a 305.8% gain over the past year compared to the Sensex’s decline of 6.59%.
Read full news article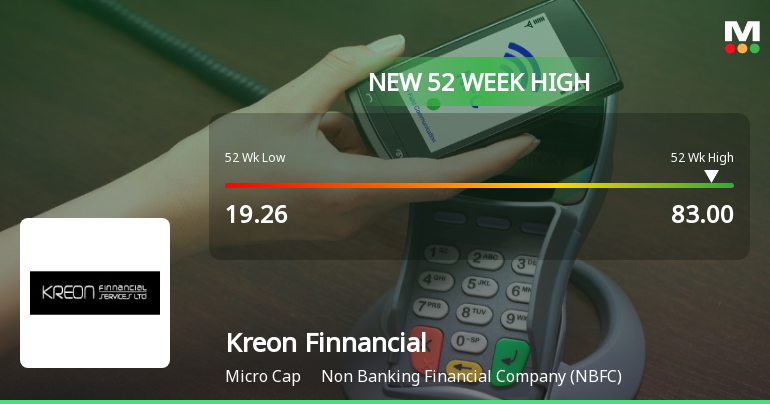
Broad-Based Technical Strength Lifts Kreon Finnancial Services Ltd to 52-Week High of Rs 83
After a sustained rally that has seen Kreon Finnancial Services Ltd surge over 240% in the past year, the stock touched a fresh 52-week high of Rs 83 on 8 Jul 2026, underscoring the powerful momentum behind this micro-cap NBFC.
Read full news article Announcements
Intimation Of Receipt Of GST Certificate Of Appreciation
13-Jul-2026 | Source : BSEIntimation of receipt of GST Certificate of Appreciation
Compliances-Certificate under Reg. 74 (5) of SEBI (DP) Regulations 2018
02-Jul-2026 | Source : BSECompliance Certificate under Regulation 74(5) of the SEBI(Depositories and Participants) Regulations 2018 for the quarter ended June 30 2026
Financial Results For The Quarter/Year Ended March 31 2026
01-Jul-2026 | Source : BSEFinancial Results of the Company for the year ended March 31 2026 along with the Statutory Audit Report
Corporate Actions

No Upcoming Board Meetings

No Dividend history available

No Splits history available

No Bonus history available

No Rights history available
Quality key factors
Valuation key factors
Technicals key factors
 Technical Indicator Scale: Bearish, Mildly Bearish, Sideways, Mildly Bullish, Bullish Turned
 Shareholding Snapshot : Mar 2026
Shareholding Compare (%holding)
Promoters
None
Held by 0 Schemes
Held by 0 FIIs
Jaijash Tatia (19.65%)
Subh Labh Infrastructure Private Limited (8.7%)
26.92%
Quarterly Results Snapshot (Standalone) - Mar'26 - QoQ

QoQ Growth in quarter ended Mar 2026 is 2.50% vs 1.21% in Dec 2025

QoQ Growth in quarter ended Mar 2026 is -66.36% vs -47.80% in Dec 2025
Half Yearly Results Snapshot (Standalone) - Sep'25
Growth in half year ended Sep 2025 is 85.93% vs 55.47% in Sep 2024
Growth in half year ended Sep 2025 is 1,516.67% vs -81.82% in Sep 2024
Nine Monthly Results Snapshot (Standalone) - Dec'25
YoY Growth in nine months ended Dec 2025 is 74.97% vs 51.47% in Dec 2024
YoY Growth in nine months ended Dec 2025 is 305.06% vs -758.82% in Dec 2024
Annual Results Snapshot (Standalone) - Mar'26
YoY Growth in year ended Mar 2026 is 67.99% vs 40.89% in Mar 2025
YoY Growth in year ended Mar 2026 is 275.36% vs -767.74% in Mar 2025
About Kreon Finnancial Services Ltd

Company Coordinates


