
Compare Krishana Phosch. with Similar Stocks
Total Returns (Price + Dividend) 
Latest dividend: 0.5 per share ex-dividend date: Jun-17-2026
Risk Adjusted Returns v/s
Returns Beta

News
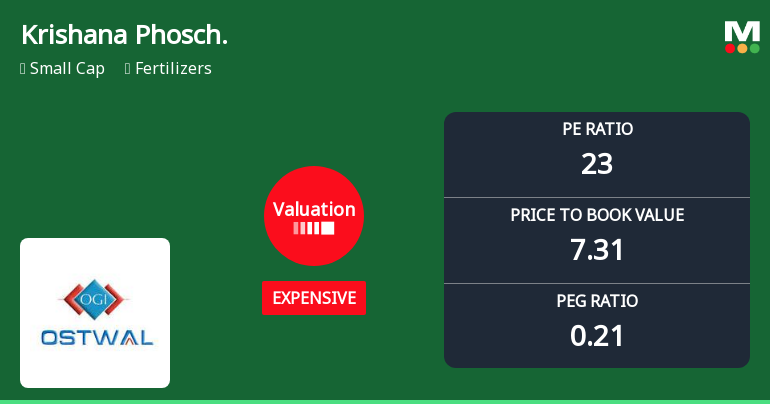
Krishana Phoschem Ltd Valuation Shifts Signal Changing Price Attractiveness
Krishana Phoschem Ltd, a notable player in the fertilisers sector, has witnessed a significant shift in its valuation parameters, moving from a fair to an expensive rating. This change reflects evolving market perceptions amid robust financial performance and a strong return profile, prompting a reassessment of its price attractiveness relative to peers and historical benchmarks.
Read full news article
Krishana Phoschem Ltd is Rated Buy by MarketsMOJO
Krishana Phoschem Ltd is rated Buy by MarketsMOJO, with this rating last updated on 22 April 2026. While the rating change occurred on that date, the analysis and financial metrics discussed here reflect the company’s current position as of 14 June 2026, providing investors with the most up-to-date insight into the stock’s fundamentals, returns, and technical outlook.
Read full news article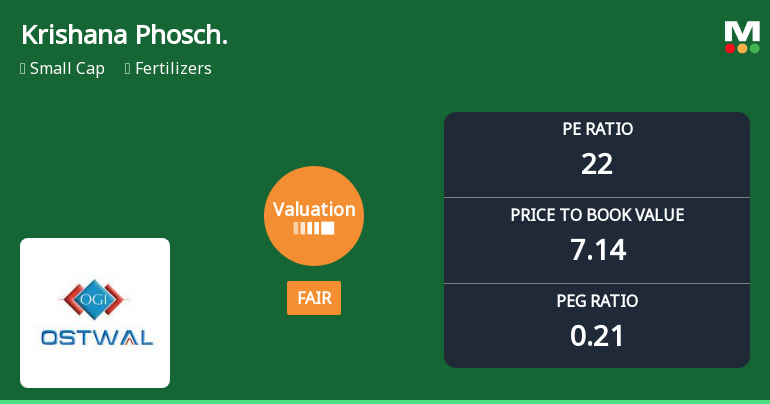
Krishana Phoschem Ltd Valuation Shifts Signal Renewed Price Attractiveness
Krishana Phoschem Ltd has witnessed a notable shift in its valuation parameters, moving from an expensive to a fair valuation grade. This change, coupled with robust financial metrics and strong returns relative to the Sensex, highlights a renewed price attractiveness for investors in the fertiliser sector.
Read full news article Announcements
Krishana Phoschem Limited - Outcome of Board Meeting
13-Nov-2019 | Source : NSEKrishana Phoschem Limited has informed the Exchange regarding Board meeting held on November 13, 2019.
Krishana Phoschem Limited - Updates
05-Nov-2019 | Source : NSEKrishana Phoschem Limited has informed the Exchange regarding 'Please find enclosed herewith extract of newspaper advertisement published for intimation of notice of Board meeting of the Company, to be held on Wednesday the 13th November, 2019, published in two newspapers viz. The Financial Express (English Edition) and Nafa Nuksan (Hindi Edition) on 05th November, 2019 in terms of Regulation 47 of SEBI (Listing Obligations and Disclosure Requirements) Regulations, 2015.
Updates
27-Aug-2019 | Source : NSE
| Krishana Phoschem Limited has informed the Exchange regarding 'Krishana Phoschem Limited has informed the Exchange regarding 'Scanned copies of Notice of AGM, Record Date and e-Voting published in the The Economic Times, English Edition and Nafa Nuksan, Hindi Edition, both dated 26.08.2019'.'. |
Corporate Actions

No Upcoming Board Meetings

Krishana Phoschem Ltd has declared 5% dividend, ex-date: 17 Jun 26

No Splits history available

Krishana Phoschem Ltd has announced 1:1 bonus issue, ex-date: 25 Oct 23

No Rights history available
Quality key factors
Valuation key factors
Technicals key factors
 Technical Indicator Scale: Bearish, Mildly Bearish, Sideways, Mildly Bullish, Bullish Turned
 Shareholding Snapshot : Mar 2026
Shareholding Compare (%holding)
Promoters
None
Held by 0 Schemes
Held by 10 FIIs (0.26%)
Ostwal Phoschem (india) Limited (67.39%)
Swastik Clothtex Private Limited (4.9%)
13.43%
Quarterly Results Snapshot (Standalone) - Mar'26 - YoY

YoY Growth in quarter ended Mar 2026 is 59.76% vs 79.53% in Mar 2025
YoY Growth in quarter ended Mar 2026 is 152.83% vs 487.84% in Mar 2025
Half Yearly Results Snapshot (Standalone) - Sep'25

Growth in half year ended Sep 2025 is 72.61% vs 35.11% in Sep 2024
Growth in half year ended Sep 2025 is 92.25% vs 6.35% in Sep 2024
Nine Monthly Results Snapshot (Standalone) - Dec'25
YoY Growth in nine months ended Dec 2025 is 87.78% vs 34.04% in Dec 2024
YoY Growth in nine months ended Dec 2025 is 80.80% vs 53.93% in Dec 2024
Annual Results Snapshot (Standalone) - Mar'26
YoY Growth in year ended Mar 2026 is 78.02% vs 47.01% in Mar 2025
YoY Growth in year ended Mar 2026 is 108.17% vs 114.00% in Mar 2025
About Krishana Phoschem Ltd

Company Coordinates


