
Compare Kriti Industries with Similar Stocks
Dashboard
Weak Long Term Fundamental Strength with a -21.20% CAGR growth in Operating Profits over the last 5 years
- Company's ability to service its debt is weak with a poor EBIT to Interest (avg) ratio of 1.07
- The company has been able to generate a Return on Equity (avg) of 5.65% signifying low profitability per unit of shareholders funds
Below par performance in long term as well as near term
Stock DNA
Plastic Products - Industrial
INR 385 Cr (Micro Cap)
103.00
35
0.00%
0.34
1.63%
1.68
Total Returns (Price + Dividend) 
Latest dividend: 0.2 per share ex-dividend date: Jun-11-2024
Risk Adjusted Returns v/s
Returns Beta

News
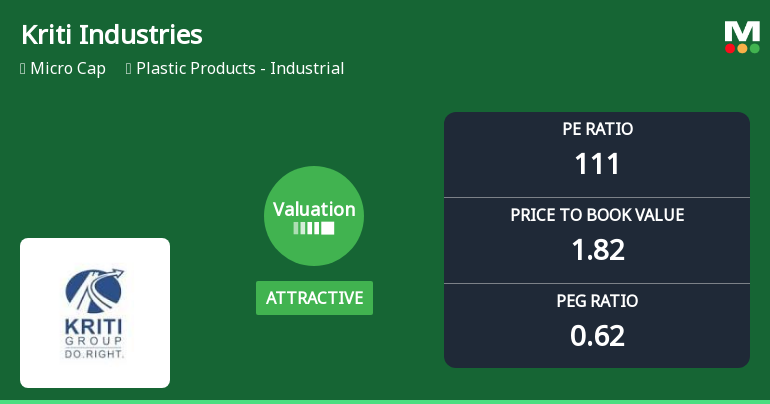
Kriti Industries Valuation Shifts to Attractive Amid Mixed Market Performance
Kriti Industries (India) Ltd has witnessed a notable shift in its valuation parameters, moving from a fair to an attractive rating despite its elevated price-to-earnings (P/E) ratio. This micro-cap player in the Plastic Products - Industrial sector has seen its market sentiment improve, reflected in a 4.49% gain on 4 June 2026, yet its financial metrics present a complex picture for investors weighing risk against potential reward.
Read full news article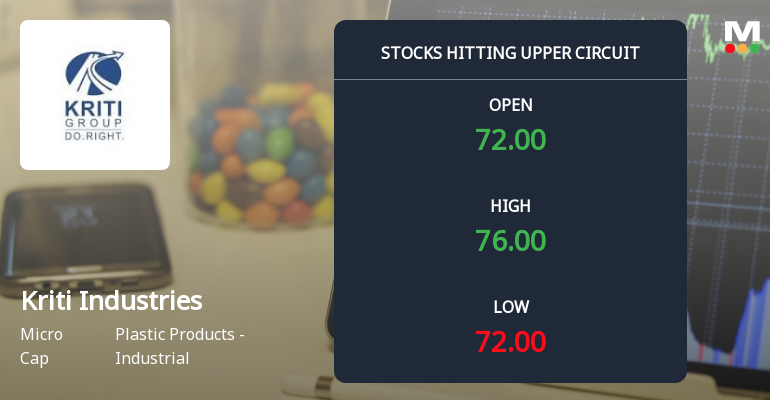
Kriti Industries (India) Ltd Locks at Upper Circuit With 5% Gain — Buyers Queue, Sellers Absent
At Rs 75.31, the buying was done — not because demand dried up, but because the exchange wouldn't let the stock go any higher. Kriti Industries (India) Ltd locked at its upper circuit of 4.99% on 1 Jun 2026, with buyers queuing and no sellers willing to part with shares.
Read full news article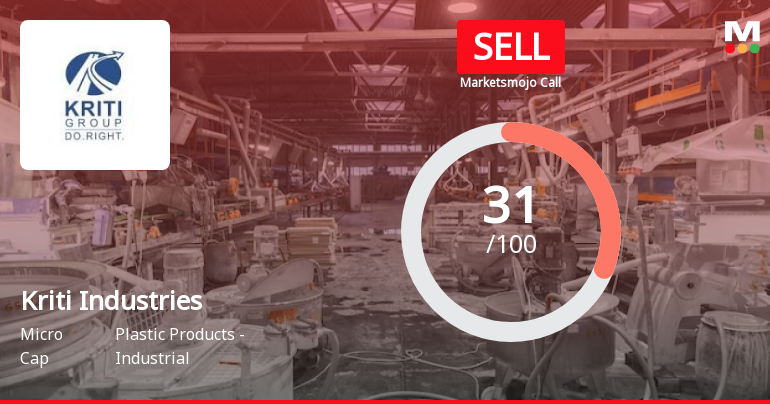
Kriti Industries (India) Ltd is Rated Sell
Kriti Industries (India) Ltd is rated 'Sell' by MarketsMOJO, with this rating last updated on 06 May 2026. However, the analysis and financial metrics discussed here reflect the stock's current position as of 26 May 2026, providing investors with an up-to-date view of the company’s fundamentals, valuation, financial trends, and technical outlook.
Read full news article Announcements
Compliances-Reg.24(A)-Annual Secretarial Compliance
20-May-2026 | Source : BSESubmission of Annual Secretarial Compliance Report for the year ended 31st March2026.
Announcement under Regulation 30 (LODR)-Earnings Call Transcript
13-May-2026 | Source : BSESubmission of Earning Call Transcript dated 06.05.2026
Announcement under Regulation 30 (LODR)-Change in Management
12-May-2026 | Source : BSEIntimation of completion of tenure of Shri Chandrasekharan Bhaskar - Non Executive Independent Director w.e.f. 12.05.2026
Corporate Actions

No Upcoming Board Meetings

Kriti Industries (India) Ltd has declared 20% dividend, ex-date: 11 Jun 24

Kriti Industries (India) Ltd has announced 1:10 stock split, ex-date: 13 Dec 07

No Bonus history available

No Rights history available
Quality key factors
Valuation key factors
Technicals key factors
 Technical Indicator Scale: Bearish, Mildly Bearish, Sideways, Mildly Bullish, Bullish Turned
 Shareholding Snapshot : Mar 2026
Shareholding Compare (%holding)
Promoters
None
Held by 0 Schemes
Held by 2 FIIs (0.12%)
Sakam Trading Private Limited (57.83%)
Chartered Finance & Leasing Limited (3.12%)
20.58%
Quarterly Results Snapshot (Consolidated) - Mar'26 - YoY

YoY Growth in quarter ended Mar 2026 is 3.11% vs -29.34% in Mar 2025
YoY Growth in quarter ended Mar 2026 is 209.56% vs -201.67% in Mar 2025
Half Yearly Results Snapshot (Consolidated) - Sep'25

Growth in half year ended Sep 2025 is -17.28% vs -12.74% in Sep 2024
Growth in half year ended Sep 2025 is -123.54% vs -0.87% in Sep 2024
Nine Monthly Results Snapshot (Consolidated) - Dec'25
YoY Growth in nine months ended Dec 2025 is -23.75% vs -13.04% in Dec 2024
YoY Growth in nine months ended Dec 2025 is -373.77% vs -103.33% in Dec 2024
Annual Results Snapshot (Consolidated) - Mar'26
YoY Growth in year ended Mar 2026 is -18.64% vs -16.70% in Mar 2025
YoY Growth in year ended Mar 2026 is 126.46% vs -119.47% in Mar 2025
About Kriti Industries (India) Ltd

Company Coordinates


