
Compare Krsnaa Diagnost. with Similar Stocks
Stock DNA
Healthcare Services
INR 1,765 Cr (Small Cap)
17.00
62
0.51%
0.18
10.35%
1.77
Total Returns (Price + Dividend) 
Latest dividend: 2.75 per share ex-dividend date: Sep-12-2025
Risk Adjusted Returns v/s
Returns Beta

News
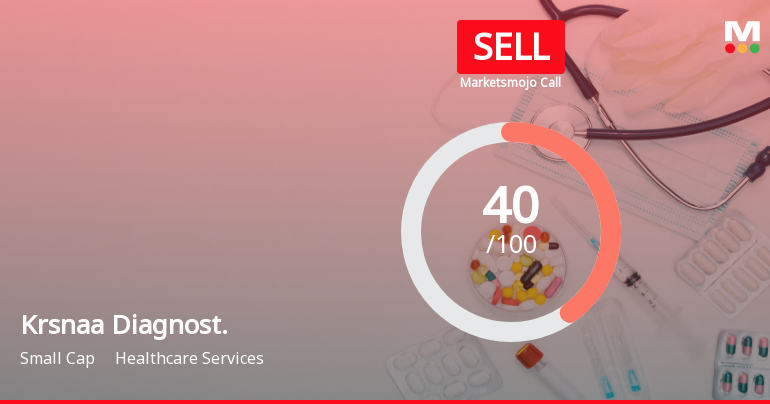
Krsnaa Diagnostics Ltd is Rated Sell
Krsnaa Diagnostics Ltd is rated 'Sell' by MarketsMOJO, with this rating last updated on 06 February 2026. However, the analysis and financial metrics presented here reflect the stock's current position as of 21 June 2026, providing investors with an up-to-date view of the company's performance and outlook.
Read full news article
Krsnaa Diagnostics Ltd Faces Bearish Momentum Amid Technical Downturn
Krsnaa Diagnostics Ltd, a small-cap player in the Healthcare Services sector, has experienced a notable shift in its technical momentum, with key indicators signalling a bearish trend. Despite a recent downgrade from Strong Sell to Sell, the stock’s price action and technical parameters reveal a complex picture of weakening momentum and cautious investor sentiment.
Read full news article
Krsnaa Diagnostics Ltd is Rated Sell
Krsnaa Diagnostics Ltd is rated 'Sell' by MarketsMOJO, with this rating last updated on 06 February 2026. However, the analysis and financial metrics discussed here reflect the stock's current position as of 10 June 2026, providing investors with an up-to-date view of the company’s fundamentals, returns, and market performance.
Read full news article Announcements
Announcement under Regulation 30 (LODR)-Newspaper Publication
04-Jun-2026 | Source : BSENewspaper Publication for issue of Postal Ballot Notice
Shareholder Meeting / Postal Ballot-Notice of Postal Ballot
03-Jun-2026 | Source : BSENotice of Postal Ballot
Announcement under Regulation 30 (LODR)-Newspaper Publication
27-May-2026 | Source : BSENewspaper publication for the quarter and year ended March 31 2026
Corporate Actions

No Upcoming Board Meetings

Krsnaa Diagnostics Ltd has declared 55% dividend, ex-date: 12 Sep 25

No Splits history available

No Bonus history available

No Rights history available
Quality key factors
Valuation key factors
Technicals key factors
 Technical Indicator Scale: Bearish, Mildly Bearish, Sideways, Mildly Bullish, Bullish Turned
 Shareholding Snapshot : Mar 2026
Shareholding Compare (%holding)
Non Institution
None
Held by 4 Schemes (10.17%)
Held by 50 FIIs (3.91%)
Rajendra Khivraj Mutha (24.75%)
Phi Capital Trust - Phi Capital Growth Fund - I (15.37%)
28.68%
Quarterly Results Snapshot (Consolidated) - Mar'26 - QoQ

QoQ Growth in quarter ended Mar 2026 is 6.29% vs -12.03% in Dec 2025
QoQ Growth in quarter ended Mar 2026 is 173.57% vs -36.33% in Dec 2025
Half Yearly Results Snapshot (Consolidated) - Sep'25

Growth in half year ended Sep 2025 is 11.89% vs 20.86% in Sep 2024
Growth in half year ended Sep 2025 is 18.52% vs 49.24% in Sep 2024
Nine Monthly Results Snapshot (Consolidated) - Dec'25
YoY Growth in nine months ended Dec 2025 is 9.24% vs 17.15% in Dec 2024
YoY Growth in nine months ended Dec 2025 is 4.88% vs 49.41% in Dec 2024
Annual Results Snapshot (Consolidated) - Mar'26
YoY Growth in year ended Mar 2026 is 7.75% vs 15.74% in Mar 2025
YoY Growth in year ended Mar 2026 is 30.69% vs 36.54% in Mar 2025
About Krsnaa Diagnostics Ltd

Company Coordinates


