
 Price Point
Compare L G Balakrishnan with Similar Stocks
ScoreDashboard
High Management Efficiency with a high ROE of 16.75%
The company is Net-Debt Free
Poor long term growth as Net Sales has grown by an annual rate of 12.23% and Operating profit at 11.37% over the last 5 years
Flat results in Jun 26
With ROE of 14.7, it has a Attractive valuation with a 2.4 Price to Book Value
Majority shareholders : Non Institution
Market Beating Performance
Mojo ParametersStock DNA

Auto Components & Equipments

INR 5,109 Cr (Small Cap)

16.00
42

1.38%

-0.03

14.74%

2.37
Total ReturnsTotal Returns (Price + Dividend) 
Latest dividend: 21.970511221945134 per share ex-dividend date: Aug-19-2026
Risk Adjusted Returns v/s
Returns Beta
 News & Corporate Actions
News
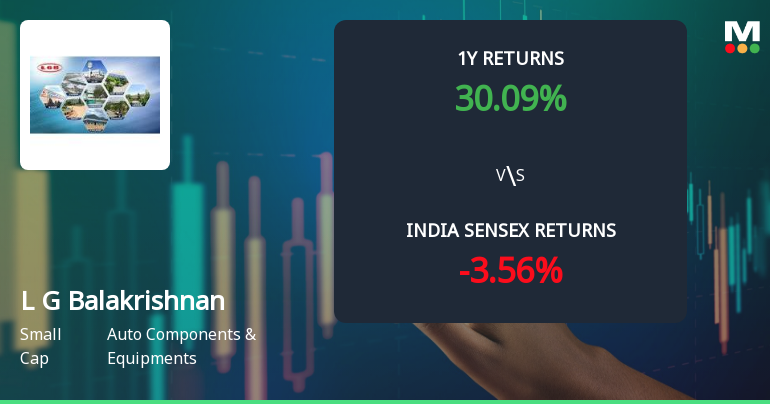
L G Balakrishnan & Bros Ltd Technical Momentum Shifts to Mildly Bullish Amid Mixed Indicators
L G Balakrishnan & Bros Ltd, a small-cap player in the Auto Components & Equipments sector, has recently exhibited a notable shift in its technical momentum, moving from a mildly bearish stance to a mildly bullish one. This change is underscored by mixed signals from key technical indicators such as MACD, RSI, moving averages, and Bollinger Bands, suggesting cautious optimism for investors amid a volatile market backdrop.
Read full news article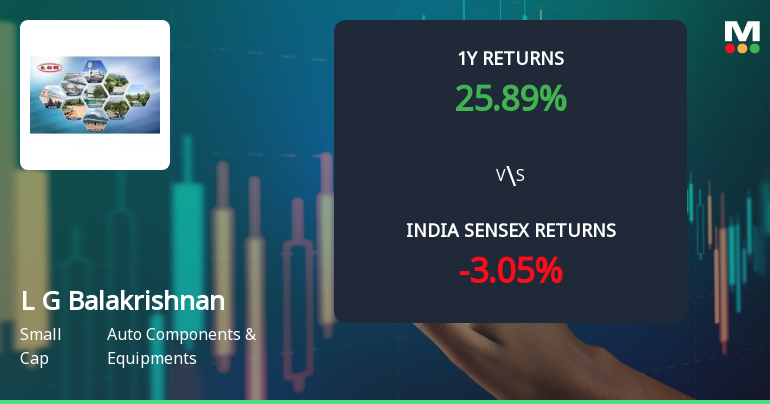
L G Balakrishnan & Bros Ltd Technical Momentum Shifts Amid Mixed Signals
L G Balakrishnan & Bros Ltd, a small-cap player in the Auto Components & Equipments sector, has experienced a notable shift in its technical momentum, moving from a sideways trend to a mildly bearish stance. Despite a recent downgrade in daily moving averages and mixed signals from key technical indicators such as MACD and Bollinger Bands, the stock’s longer-term outlook retains some bullish undertones, reflecting a complex interplay of market forces and investor sentiment.
Read full news article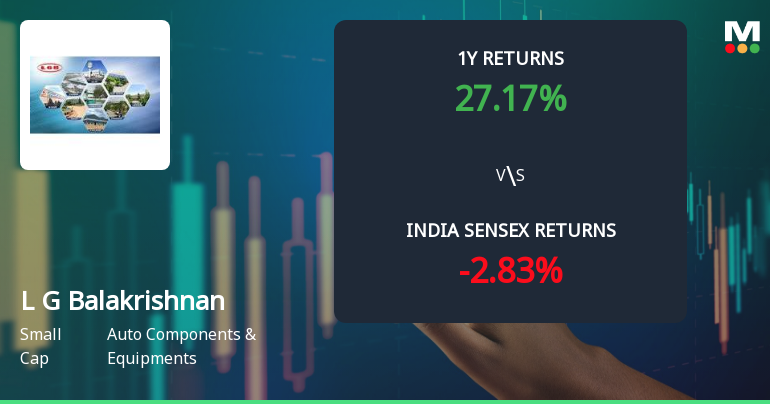
L G Balakrishnan & Bros Ltd Technical Momentum Shifts Amid Mixed Signals
L G Balakrishnan & Bros Ltd, a small-cap player in the Auto Components & Equipments sector, has experienced a notable shift in its technical momentum, moving from a mildly bearish stance to a more sideways trend. This transition is underscored by a complex interplay of technical indicators, including MACD, RSI, moving averages, and Bollinger Bands, signalling a nuanced outlook for investors as the stock trades at ₹1,601.20, up 3.22% on the day.
Read full news article Announcements
Announcement under Regulation 30 (LODR)-Newspaper Publication
13-Aug-2026 | Source : BSEThe copies of newspaper advertisement related to "Special Window for re-lodgement of transfer requests of Physical Shares" are attached.
Announcement under Regulation 30 (LODR)-Newspaper Publication
01-Aug-2026 | Source : BSEPursuant to Regulation 47(3) of SEBI LODR Regulations 2015 the newspaper publication of Audited Financial Results for the quarter ended June 30 2026 is attached.
Audited Financial Results 30.06.2026
31-Jul-2026 | Source : BSEIntimation under Regulation 30 of SEBI LODR Regulations alongwith Audited Financials with Auditors Report is attached
Corporate Actions

No Upcoming Board Meetings

L G Balakrishnan & Bros Ltd has declared 220% dividend, ex-date: 19 Aug 26

L G Balakrishnan & Bros Ltd has announced 10:1 stock split, ex-date: 15 Mar 10

L G Balakrishnan & Bros Ltd has announced 1:1 bonus issue, ex-date: 14 Jun 18

No Rights history available
Key FactorsQuality key factors
Valuation key factors
Technicals key factors
 Technical Indicator Scale: Bearish, Mildly Bearish, Sideways, Mildly Bullish, Bullish Turned Shareholding
Shareholding Snapshot : Jun 2026
Shareholding Compare (%holding)
Non Institution
None
Held by 5 Schemes (13.45%)
Held by 97 FIIs (6.42%)
B Vijayakumar (11.47%)
Hdfc Small Cap Fund (9.27%)
38.26%
FinancialQuarterly Results Snapshot (Consolidated) - Jun'26 - QoQ
 Compare with Peers
QoQ Growth in quarter ended Jun 2026 is -1.99% vs -0.19% in Mar 2026

QoQ Growth in quarter ended Jun 2026 is -3.89% vs -21.15% in Mar 2026

Half Yearly Results Snapshot (Consolidated) - Sep'25
Growth in half year ended Sep 2025 is 17.19% vs 8.21% in Sep 2024
Growth in half year ended Sep 2025 is 12.48% vs 9.03% in Sep 2024
Nine Monthly Results Snapshot (Consolidated) - Dec'25
YoY Growth in nine months ended Dec 2025 is 18.41% vs 9.78% in Dec 2024
YoY Growth in nine months ended Dec 2025 is 14.19% vs 7.17% in Dec 2024
Annual Results Snapshot (Consolidated) - Mar'26
YoY Growth in year ended Mar 2026 is 19.29% vs 9.90% in Mar 2025
YoY Growth in year ended Mar 2026 is 5.51% vs 11.34% in Mar 2025
 Company CV
About L G Balakrishnan & Bros Ltd

Company Coordinates










