
Compare L T Foods with Similar Stocks
Dashboard
High Management Efficiency with a high ROCE of 15.80%
Strong ability to service debt as the company has a low Debt to EBITDA ratio of 1.39 times
Negative results in Mar 26
With ROCE of 15.8, it has a Attractive valuation with a 2.5 Enterprise value to Capital Employed
Majority shareholders : Promoters
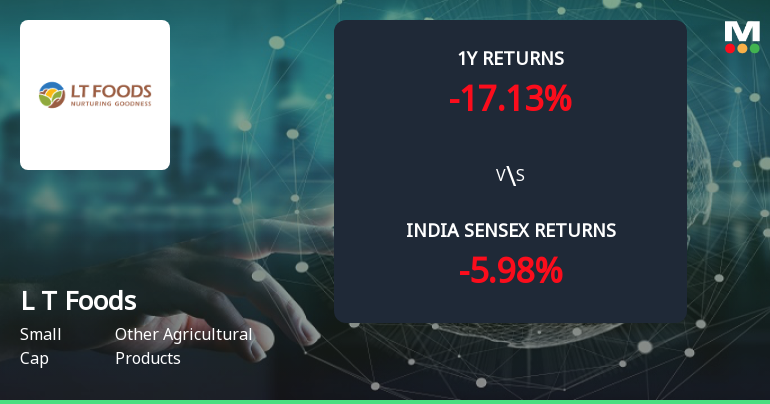
Underperformed the market in the last 1 year
With its market cap of Rs 13,265 cr, it is the second biggest company in the sector (behind Kajaria Ceramics)and constitutes 23.28% of the entire sector
Stock DNA
Other Agricultural Products
INR 13,369 Cr (Small Cap)
21.00
30
0.79%
0.28
13.83%
2.93
Total Returns (Price + Dividend) 
Latest dividend: 0.9816939890710383 per share ex-dividend date: Feb-02-2026
Risk Adjusted Returns v/s
Returns Beta

News
L T Foods Ltd Forms Golden Cross Amid Mixed Technical Signals and Modest Price Moves
The 50-day moving average for L T Foods Ltd has crossed above the 200-day moving average, creating a golden cross on 15 Jun 2026. Yet, the broader technical indicators and recent price performance paint a more nuanced picture, suggesting the signal should be interpreted with caution rather than certainty.
Read full news article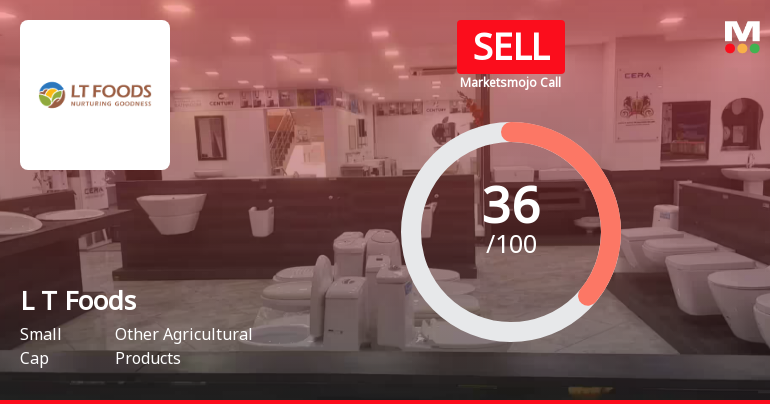
L T Foods Ltd is Rated Sell by MarketsMOJO
L T Foods Ltd is rated 'Sell' by MarketsMOJO, with this rating last updated on 15 May 2026. However, the analysis and financial metrics presented here reflect the stock's current position as of 14 June 2026, providing investors with an up-to-date view of the company's performance and outlook.
Read full news article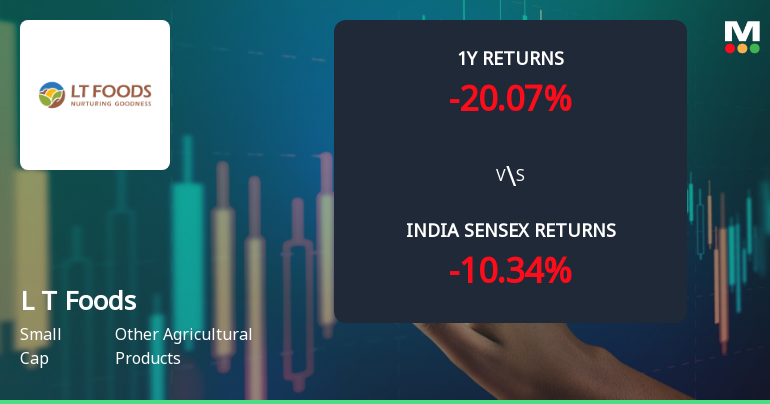
L T Foods Ltd Technical Momentum Shifts Amid Bearish Signals
L T Foods Ltd has experienced a notable shift in its technical momentum, with key indicators signalling a transition from mildly bearish to bearish trends. Despite a modest intraday price increase, the stock’s technical parameters suggest caution for investors amid mixed signals from momentum oscillators and moving averages.
Read full news article Announcements
Announcement under Regulation 30 (LODR)-Analyst / Investor Meet - Intimation
12-Jun-2026 | Source : BSEIntimation of Schedule of Analysts Call.
Compliances-Reg.24(A)-Annual Secretarial Compliance
22-May-2026 | Source : BSEAnnual Secretarial Compliance Report for the FY 2025-26.
Announcement under Regulation 30 (LODR)-Earnings Call Transcript
20-May-2026 | Source : BSETranscript of Analyst/Investors Conference Call for the quarter and financial year ended March 312026.
Corporate Actions

No Upcoming Board Meetings

L T Foods Ltd has declared 100% dividend, ex-date: 02 Feb 26

L T Foods Ltd has announced 1:10 stock split, ex-date: 07 Feb 17

No Bonus history available

No Rights history available
Quality key factors
Valuation key factors
Technicals key factors
 Technical Indicator Scale: Bearish, Mildly Bearish, Sideways, Mildly Bullish, Bullish Turned
 Shareholding Snapshot : Mar 2026
Shareholding Compare (%holding)
Promoters
None
Held by 19 Schemes (9.02%)
Held by 149 FIIs (8.74%)
Raghuvesh Holdings Private Limited (9.61%)
Salic International Investment Company (9.22%)
16.84%
Quarterly Results Snapshot (Consolidated) - Mar'26 - YoY

YoY Growth in quarter ended Mar 2026 is 30.44% vs 7.40% in Mar 2025

YoY Growth in quarter ended Mar 2026 is -15.48% vs 7.91% in Mar 2025
Half Yearly Results Snapshot (Consolidated) - Sep'25
Growth in half year ended Sep 2025 is 25.16% vs 11.25% in Sep 2024
Growth in half year ended Sep 2025 is 10.21% vs 2.78% in Sep 2024
Nine Monthly Results Snapshot (Consolidated) - Dec'25
YoY Growth in nine months ended Dec 2025 is 24.57% vs 13.26% in Dec 2024
YoY Growth in nine months ended Dec 2025 is 10.09% vs 0.05% in Dec 2024
Annual Results Snapshot (Consolidated) - Mar'26
YoY Growth in year ended Mar 2026 is 26.08% vs 11.70% in Mar 2025
YoY Growth in year ended Mar 2026 is 3.31% vs 2.02% in Mar 2025
About L T Foods Ltd

Company Coordinates


