
Compare L&T Technology with Similar Stocks
Dashboard
Strong Long Term Fundamental Strength with an average Return on Equity (ROE) of 23.08%
- Healthy long term growth as Net Sales has grown by an annual rate of 15.31%
- The company is Net-Debt Free
Positive results in Jun 26
With ROE of 20.1, it has a Expensive valuation with a 5.8 Price to Book Value
Majority shareholders : Promoters
Consistent Underperformance against the benchmark over the last 3 years
Stock DNA
Computers - Software & Consulting
INR 37,117 Cr (Mid Cap)
28.00
21
1.63%
-0.39
20.14%
5.84
Total Returns (Price + Dividend) 
Latest dividend: 39.96845471937844 per share ex-dividend date: May-22-2026
Risk Adjusted Returns v/s
Returns Beta

News

L&T Technology Services Ltd is Rated Hold by MarketsMOJO
L&T Technology Services Ltd is rated 'Hold' by MarketsMOJO, with this rating last updated on 15 Apr 2026. However, the analysis and financial metrics discussed here reflect the stock's current position as of 24 July 2026, providing investors with an up-to-date view of the company’s fundamentals, valuation, financial trends, and technical outlook.
Read full news article
L&T Technology Services Ltd Sees Mixed Technical Signals Amid Price Momentum Shift
L&T Technology Services Ltd (L&T Tech) has experienced a notable shift in its technical momentum, moving from a bearish stance to a mildly bearish outlook, reflecting a complex interplay of technical indicators. Despite a modest day gain of 1.23%, the stock’s medium- and long-term charts reveal mixed signals, underscoring the need for investors to carefully analyse momentum and trend indicators before positioning.
Read full news article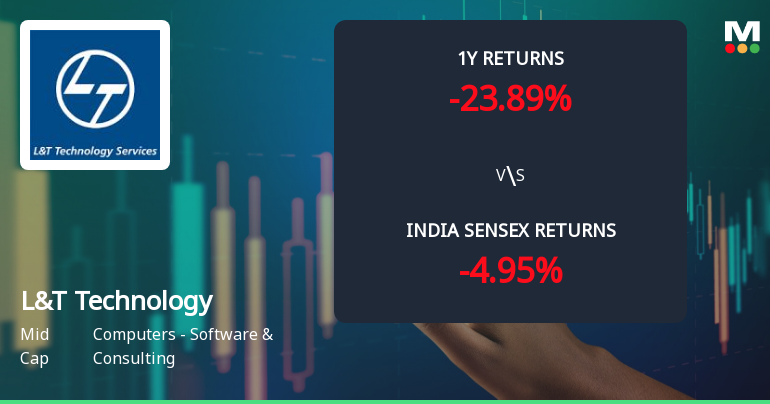
L&T Technology Services Ltd Faces Bearish Momentum Amid Mixed Technical Signals
L&T Technology Services Ltd (L&T Tech) has experienced a notable shift in its technical momentum, with key indicators signalling a transition from mildly bearish to bearish trends. Despite a recent downgrade in market sentiment, the stock’s technical parameters reveal a complex interplay of bullish and bearish signals, underscoring the need for cautious investor appraisal amid broader sectoral and market dynamics.
Read full news article Announcements
L&T Technology Services Limited - Updates
09-Dec-2019 | Source : NSEL&T Technology Services Limited has informed the Exchange regarding 'Change of name of our Registrar & Share Transfer Agent (RTA) from Karvy Fintech Private Limited to KFin Technologies Private Limited'.
L&T Technology Services Limited - Updates
05-Dec-2019 | Source : NSEL&T Technology Services Limited has informed the Exchange regarding 'Intimation under Regulation 30 of SEBI (Listing Obligations and Disclosure
L&T Technology Services Limited - Press Release
27-Nov-2019 | Source : NSEL&T Technology Services Limited has informed the Exchange regarding a press release dated November 27, 2019, titled " L&T Technology Services recognized as a Leader among IoT services providers in Zinnov Zones 2019 ".
Corporate Actions

No Upcoming Board Meetings

L&T Technology Services Ltd has declared 2000% dividend, ex-date: 22 May 26

No Splits history available

No Bonus history available

No Rights history available
Quality key factors
Valuation key factors
Technicals key factors
 Technical Indicator Scale: Bearish, Mildly Bearish, Sideways, Mildly Bullish, Bullish Turned
 Shareholding Snapshot : Jun 2026
Shareholding Compare (%holding)
Promoters
None
Held by 26 Schemes (3.69%)
Held by 112 FIIs (4.12%)
Larsen And Toubro Limited (73.52%)
Life Insurance Corporation Of India (6.91%)
6.58%
Quarterly Results Snapshot (Consolidated) - Jun'26 - YoY

YoY Growth in quarter ended Jun 2026 is 11.47% vs 7.13% in Jun 2025
YoY Growth in quarter ended Jun 2026 is 12.96% vs 0.67% in Jun 2025
Half Yearly Results Snapshot (Consolidated) - Sep'25
Growth in half year ended Sep 2025 is 16.10% vs 7.40% in Sep 2024
Growth in half year ended Sep 2025 is 1.77% vs 1.07% in Sep 2024
Nine Monthly Results Snapshot (Consolidated) - Dec'25
YoY Growth in nine months ended Dec 2025 is 12.29% vs 8.13% in Dec 2024

YoY Growth in nine months ended Dec 2025 is -0.90% vs -0.74% in Dec 2024
Annual Results Snapshot (Consolidated) - Mar'26
YoY Growth in year ended Mar 2026 is 14.04% vs -0.05% in Mar 2025
YoY Growth in year ended Mar 2026 is 0.99% vs -2.84% in Mar 2025
About L&T Technology Services Ltd

Company Coordinates


