
Compare La Tim Metal & I with Similar Stocks
Dashboard
High Management Efficiency with a high ROCE of 18.05%
Low ability to service debt as the company has a high Debt to EBITDA ratio of 3.50 times
With a growth in Net Sales of 43.68%, the company declared Very Positive results in Mar 26
With ROCE of 10.1, it has a Very Attractive valuation with a 1.3 Enterprise value to Capital Employed
Majority shareholders : Promoters
Stock DNA
Non - Ferrous Metals
INR 119 Cr (Micro Cap)
14.00
33
0.00%
0.63
10.40%
1.52
Total Returns (Price + Dividend) 
Latest dividend: 0.039850000000000003 per share ex-dividend date: Sep-20-2021
Risk Adjusted Returns v/s
Returns Beta

News
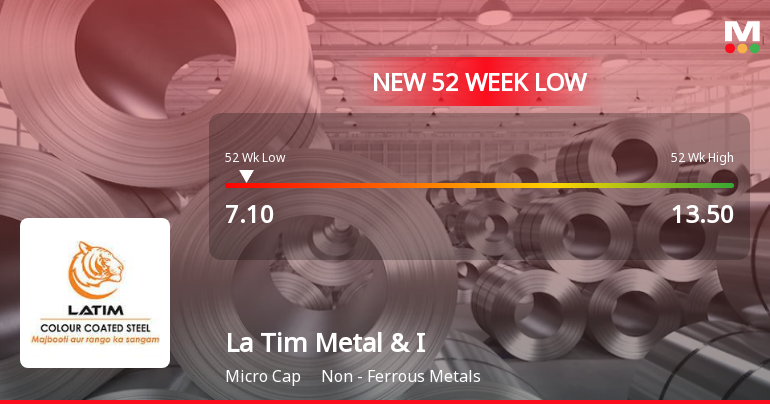
Five Consecutive Losses Push La Tim Metal & Industries Ltd to a New 52-Week Low
For the fifth consecutive session, La Tim Metal & Industries Ltd has closed lower, slipping to a fresh 52-week low of Rs 7.1 on 13 Jul 2026. This marks a sharp 30.39% decline over the past five trading days, underscoring sustained selling pressure despite a broadly resilient market backdrop.
Read full news article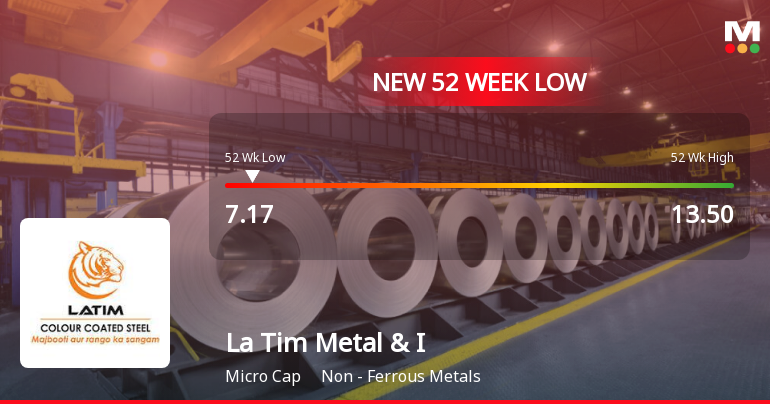
Five Consecutive Losses Push La Tim Metal & Industries Ltd to a New 52-Week Low
For the fifth straight session, La Tim Metal & Industries Ltd closed lower, breaching its 52-week low at Rs 7.17 on 10 Jul 2026, marking a 26.86% decline over this losing streak and underperforming its sector by 5.07% today.
Read full news article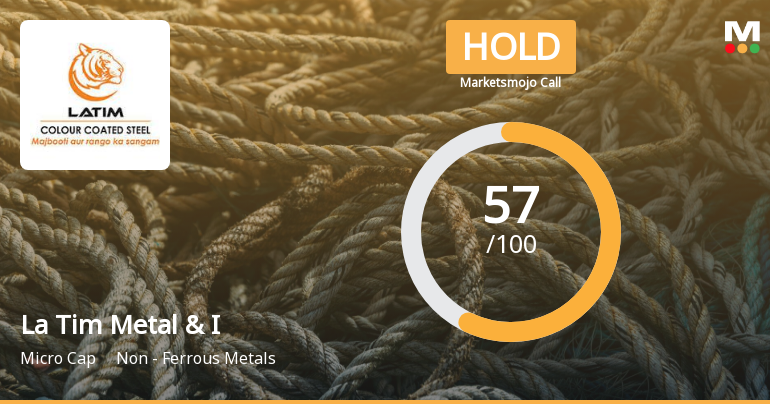
La Tim Metal & Industries Ltd is Rated Hold
La Tim Metal & Industries Ltd is rated 'Hold' by MarketsMOJO. This rating was last updated on 14 May 2026, reflecting a reassessment of the stock’s outlook. However, all fundamentals, returns, and financial metrics discussed here are current as of 08 July 2026, providing investors with the latest perspective on the company’s position.
Read full news article Announcements
Reply To The Clarification Sought On Movement In Price Of The Shares Across Exchanges Of Shares Of The Company Regulation 30 Of The SEBI (LODR) Regulations 2015
15-Jul-2026 | Source : BSEReply to the Clarification Sought on movement in price of the shares across exchanges of shares of the company regulation 30 of the SEBI (LODR) Reg 2015
Compliances-Certificate under Reg. 74 (5) of SEBI (DP) Regulations 2018
13-Jul-2026 | Source : BSEEnclosed herewith Certificate under Regulation 74(5) of SEBI(Depositories & Participants) Regulations 2018 for the quarter ended 30th June 2026
Clarification Sought from La Tim Metal & Industries Ltd
13-Jul-2026 | Source : BSEThe Exchange has sought clarification from La Tim Metal & Industries Ltd on July 13 2026 with reference to significant movement in price in order to ensure that investors have latest relevant information about the company and to inform the market so that the interest of the investors is safeguarded.
The reply is awaited.
Corporate Actions

No Upcoming Board Meetings

La Tim Metal & Industries Ltd has declared 5% dividend, ex-date: 20 Sep 21

La Tim Metal & Industries Ltd has announced 1:10 stock split, ex-date: 20 May 22

No Bonus history available

La Tim Metal & Industries Ltd has announced 1:2 rights issue, ex-date: 02 Jan 24
Quality key factors
Valuation key factors
Technicals key factors
 Technical Indicator Scale: Bearish, Mildly Bearish, Sideways, Mildly Bullish, Bullish Turned
 Shareholding Snapshot : Jun 2026
Shareholding Compare (%holding)
Promoters
None
Held by 0 Schemes
Held by 1 FIIs (0.54%)
Almitra Ballal Chandrachud (9.58%)
Ramesh Thakurdas Jaisinghani (4.52%)
29.7%
Quarterly Results Snapshot (Standalone) - Mar'26 - QoQ

QoQ Growth in quarter ended Mar 2026 is 43.68% vs -3.51% in Dec 2025

QoQ Growth in quarter ended Mar 2026 is 28.04% vs 28.57% in Dec 2025
Half Yearly Results Snapshot (Consolidated) - Sep'25
Not Applicable: The company has declared_date for only one period
Not Applicable: The company has declared_date for only one period
Nine Monthly Results Snapshot (Consolidated) - Dec'25
YoY Growth in nine months ended Dec 2025 is -1.89% vs 26.69% in Jun 2025
YoY Growth in nine months ended Dec 2025 is 17.85% vs 160.55% in Jun 2025
Annual Results Snapshot (Consolidated) - Mar'26
Not Applicable: The company has declared_date for only one period
Not Applicable: The company has declared_date for only one period
About La Tim Metal & Industries Ltd

Company Coordinates


