
Compare La Tim Metal & I with Similar Stocks
Dashboard
High Management Efficiency with a high ROCE of 18.05%
Low ability to service debt as the company has a high Debt to EBITDA ratio of 3.50 times
With a growth in Net Sales of 43.68%, the company declared Very Positive results in Mar 26
With ROCE of 10.1, it has a Very Attractive valuation with a 1.3 Enterprise value to Capital Employed
Majority shareholders : Promoters
Stock DNA
Non - Ferrous Metals
INR 112 Cr (Micro Cap)
14.00
32
0.00%
0.63
10.40%
1.44
Total Returns (Price + Dividend) 
Latest dividend: 0.5 per share ex-dividend date: Sep-20-2021
Risk Adjusted Returns v/s
Returns Beta

News
La Tim Metal & Industries Ltd is Rated Hold
La Tim Metal & Industries Ltd is rated 'Hold' by MarketsMOJO, with this rating last updated on 14 May 2026. However, the analysis and financial metrics discussed here reflect the stock's current position as of 26 May 2026, providing investors with an up-to-date view of the company’s fundamentals, valuation, financial trends, and technical outlook.
Read full news article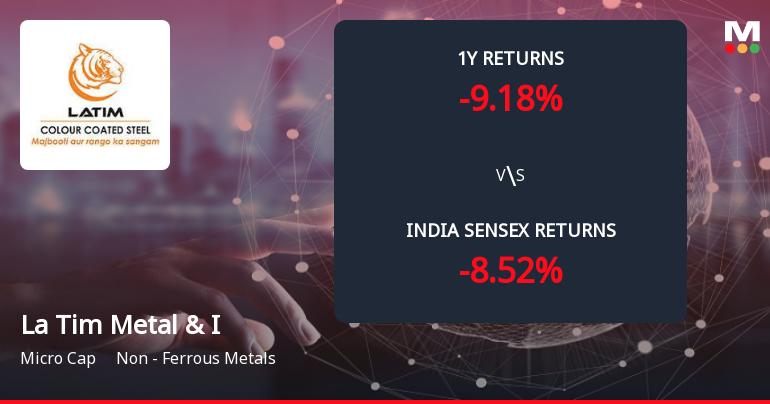
La Tim Metal & Industries Ltd Forms Death Cross, Signalling Potential Bearish Trend
La Tim Metal & Industries Ltd, a micro-cap player in the Non-Ferrous Metals sector, has recently formed a Death Cross, a technical pattern where the 50-day moving average crosses below the 200-day moving average. This development is widely regarded as a bearish signal, indicating a potential deterioration in the stock’s medium to long-term trend and raising concerns about sustained weakness ahead.
Read full news article
La Tim Metal & Industries Ltd Downgraded to Hold Amid Mixed Financial and Valuation Signals
La Tim Metal & Industries Ltd, a micro-cap player in the non-ferrous metals sector, has seen its investment rating downgraded from Buy to Hold as of 14 May 2026. Despite posting very positive quarterly financial results, the company’s valuation, financial trend, and technical indicators have presented a mixed picture, prompting a reassessment of its investment appeal.
Read full news article Announcements
Announcement under Regulation 30 (LODR)-Acquisition
02-Jun-2026 | Source : BSEAcquisition of majority stake (50.1%) in La Proviso Buildcon LLP by the Company.
Compliances-Reg.24(A)-Annual Secretarial Compliance
30-May-2026 | Source : BSEPursuant to regulation 24A of SEBI (LODR) 2015 please find enclosed the ASCR for the financial year 2025-26.
Under Regulation 30 Of Securities And Exchange Board Of India (Listing Obligations And Disclosure Requirements) Regulations 2015 As Amended Read With Applicable Circulars Issued Thereto (SEBI LODR Regulations) - Withdrawal Of In-Principle Application F
26-May-2026 | Source : BSEUnder Regulation 30 of Securities and Exchange Board of India (Listing obligation and disclosure requirements) regulation 2015 as amended read with applicable circular issued thereto(SEBI LODR Regulations)- withdrawal of in-Principal application filed for proposed preferential issue
Corporate Actions

No Upcoming Board Meetings

La Tim Metal & Industries Ltd has declared 5% dividend, ex-date: 20 Sep 21

La Tim Metal & Industries Ltd has announced 1:10 stock split, ex-date: 20 May 22

No Bonus history available

La Tim Metal & Industries Ltd has announced 1:2 rights issue, ex-date: 02 Jan 24
Quality key factors
Valuation key factors
Technicals key factors
 Technical Indicator Scale: Bearish, Mildly Bearish, Sideways, Mildly Bullish, Bullish Turned
 Shareholding Snapshot : Mar 2026
Shareholding Compare (%holding)
Promoters
None
Held by 0 Schemes
Held by 0 FIIs
Almitra Ballal Chandrachud (9.58%)
Ramesh Thakurdas Jaisinghani (4.52%)
29.16%
Quarterly Results Snapshot (Standalone) - Mar'26 - QoQ

QoQ Growth in quarter ended Mar 2026 is 43.68% vs -3.51% in Dec 2025

QoQ Growth in quarter ended Mar 2026 is 28.04% vs 28.57% in Dec 2025
Half Yearly Results Snapshot (Consolidated) - Sep'25
Not Applicable: The company has declared_date for only one period
Not Applicable: The company has declared_date for only one period
Nine Monthly Results Snapshot (Consolidated) - Dec'25
YoY Growth in nine months ended Dec 2025 is -1.89% vs 26.69% in Jun 2025
YoY Growth in nine months ended Dec 2025 is 17.85% vs 160.55% in Jun 2025
Annual Results Snapshot (Consolidated) - Mar'26
Not Applicable: The company has declared_date for only one period
Not Applicable: The company has declared_date for only one period
About La Tim Metal & Industries Ltd

Company Coordinates


