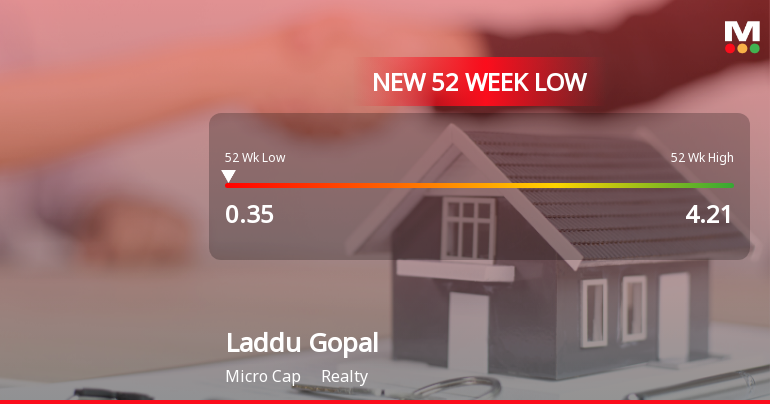
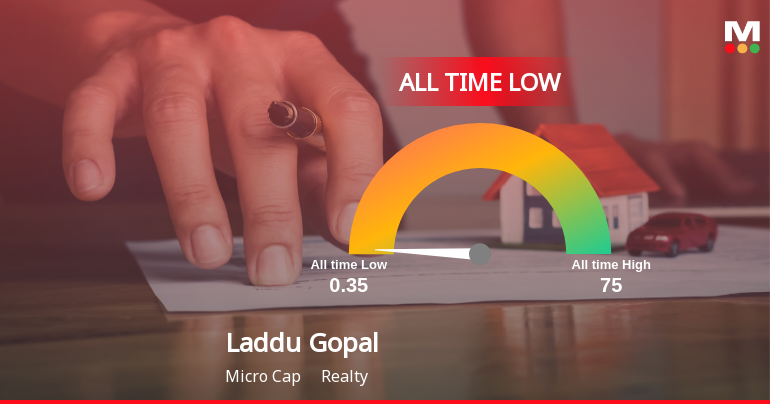
Laddu Gopal

  • Market Cap: Micro Cap
  • Industry: Realty
  • ISIN: INE546I01025
  • NSEID:
  • BSEID: 537707
INR
0.45
0.00 (0.00%)
BSENSE

Sep 01, 03:30 PM

BSE+NSE Vol: 5.63 lacs

  • Price Points
  • Score
  • Mojo Parameters
  • Total Return
  • News and Corporate Actions
  • Key factors
  • Shareholding
  • Financials
  • CompanyCV
stock-summaryPrice Point
High/Low

1Day

52 Week

Valuation
Technical
Day's Volume

CASH

5.63 lacs (52.90%) Volume

Shareholding (Jun 2026)

FII

0.00%

Held by 0 FIIs

DII

0.00%

Held by 0 DIIs

Promoter

0.00%

Why is Laddu Gopal Online Services Ltd falling/rising?

02-Sep-2026

As of 01-Sep, Laddu Gopal Online Services Ltd's stock price is 0.45, reflecting a 13.46% decline over the past week and a staggering 82.63% drop over the last year. The stock is underperforming compared to the Sensex and shows weak financial health, with negative EBITDA and declining investor participation.

As of 01-Sep, Laddu Gopal Online Services Ltd is experiencing a decline in its stock price. The current price is 0.45, with no change noted (0.00%). Over the past week, the stock has decreased by 13.46%, while it has fallen 2.17% over the past month. Year-to-date, the stock has plummeted by 57.14%, and in the last year, it has seen a staggering decline of 82.63%. This consistent underperformance is evident when compared to the benchmark Sensex, which has only decreased by 4.26% over the same period.<BR><BR>The stock is trading below its moving averages across all time frames, indicating a bearish trend. Additionally, there has been a decrease in investor participation, with delivery volume falling by 5.81% against the five-day average. The company's financial health is also concerning, as it has not declared results in the last six months, and it has reported a negative EBITDA of Rs. -1.49 crore. Furthermore, the company's ability to service its debt is weak, reflected in a poor EBIT to Interest ratio of -0.61.<BR><BR>Overall, the combination of weak long-term fundamentals, significant losses, and consistent underperformance against benchmarks contributes to the stock's declining trend.

View full answer

Who are in the management team of Laddu Gopal?

01-Sep-2026

The management team of Laddu Gopal includes Sandeep Sethi (Managing Director), Gurupreet Sangla (Joint Managing Director), and several independent directors: Ratinder Pal Singh Bhatia, Aman Batra, Roopal Sharma, and Sanjay Sharma, along with directors Sanjay Arora and Harvinder Singh, and Sanjana Rani as Company Secretary & Compliance Officer.

The management team of Laddu Gopal includes the following individuals:<BR><BR>1. **Sandeep Sethi** - Managing Director<BR>2. **Gurupreet Sangla** - Joint Managing Director<BR>3. **Ratinder Pal Singh Bhatia** - Independent Director<BR>4. **Aman Batra** - Independent Director<BR>5. **Roopal Sharma** - Independent Director<BR>6. **Sanjay Arora** - Director<BR>7. **Harvinder Singh** - Director<BR>8. **Sanjay Sharma** - Independent Director<BR>9. **Sanjana Rani** - Company Secretary & Compliance Officer<BR><BR>If you need more specific information about any of these individuals or their roles, feel free to ask!

View full answer

What does Laddu Gopal do?

01-Sep-2026

Laddu Gopal Online Services Ltd is a micro-cap company in the realty industry, previously known as ETT Limited, with net sales of 13 Cr and a market cap of INR 6 Cr as of December 2025. It has a P/E ratio of 15.00 and a negative debt-equity ratio of -0.13.

Overview: <BR>Laddu Gopal Online Services Ltd operates in the realty industry and is categorized as a micro-cap company.<BR><BR>History: <BR>The company was initially incorporated as 'Indian Express Multi Media Limited' in November 1993. It underwent a name change to ETT Limited in June 2007, and it has received shareholder approval to change its name to "Laddu Gopal Online Services Limited," effective May 15, 2025. The latest quarterly results reported net sales and profit for December 2025.<BR><BR>Financial Snapshot: <BR>Net Sales: 13 Cr (Quarterly Results - Dec 2025) <BR>Net Profit: 0 Cr (Quarterly Results - Dec 2025) <BR>Market-cap value: INR 6 Cr (Micro Cap)<BR><BR>Key Metrics: <BR>P/E: 15.00 <BR>Industry P/E: 41 <BR>Dividend Yield: 0.00% <BR>Debt Equity: -0.13 <BR>Return on Equity: 0.64% <BR>Price to Book: 0.10 <BR><BR>Contact Details: <BR>Address: No 17 Hemkunt Colony, New Delhi New Delhi: 110048 <BR>Tel: 91-011-46567575 <BR>Email: secretarial@ettgroup.in <BR>Website: http://www.ettgroup.in

View full answer

Who are the peers of the Laddu Gopal?

01-Sep-2026

Laddu Gopal's peers include Sikozy Realtors, Jet Solar, Skyline Ventures, Crane Infra, Croissance Ltd, Epsom Properties, UTL Industries, Abhishek Infra, SBL Infratech, and Athena Construc. Laddu Gopal has below average management and growth risks, a good capital structure, but the lowest 1-year return at -83.46% among its peers.

Peers: The peers of Laddu Gopal are Sikozy Realtors, Jet Solar, Skyline Ventures, Crane Infra, Croissance Ltd, Epsom Properties, UTL Industries, Abhishek Infra., SBL Infratech, and Athena Construc.<BR><BR>Quality Snapshot: Does not qualify management risk is observed at Sikozy Realtors, Jet Solar, Skyline Ventures, Epsom Properties, UTL Industries, and Abhishek Infra., while Below Average management risk is found at Crane Infra, Croissance Ltd, Laddu Gopal, and SBL Infratech. Does not qualify growth is noted for Sikozy Realtors, Jet Solar, Skyline Ventures, Epsom Properties, UTL Industries, and Abhishek Infra., while Below Average growth is seen at Crane Infra, Croissance Ltd, and Laddu Gopal, with Average growth at SBL Infratech. Good capital structure is present in Crane Infra, Croissance Ltd, Laddu Gopal, and SBL Infratech, while the rest do not qualify.<BR><BR>Return Snapshot: SBL Infratech has the highest 1-year return at 34.67%, while Laddu Gopal has the lowest at -83.46%, indicating a significantly poorer performance compared to its peers. Additionally, Crane Infra, Croissance Ltd, and Laddu Gopal all have negative six-month returns.

View full answer

How big is Laddu Gopal?

01-Sep-2026

As of 31st August, Laddu Gopal Online Services Ltd has a market capitalization of 6.00 Cr, with recent net sales of 13.21 Cr and a net profit of 0.40 Cr. The latest balance sheet shows shareholder's funds of 300.15 Cr and total assets of 316.61 Cr.

As of 31st August, Laddu Gopal Online Services Ltd has a market capitalization of 6.00 Cr, categorizing it as a Micro Cap company.<BR><BR>For the latest four quarters, the company reported Net Sales of 13.21 Cr and a Net Profit of 0.40 Cr.<BR><BR>The latest annual period for the balance sheet is March 2016, with Shareholder's Funds amounting to 300.15 Cr and Total Assets of 316.61 Cr.

View full answer

Should I buy, sell or hold Laddu Gopal Online Services Ltd?

16-Jun-2026

When is the next results date for Laddu Gopal Online Services Ltd?

11-Jun-2026

The next results date for Laddu Gopal Online Services Ltd is 15 June 2026.

The next results date for Laddu Gopal Online Services Ltd is scheduled for 15 June 2026.

View full answer

Are Laddu Gopal Online Services Ltd latest results good or bad?

20-Jan-2026

Laddu Gopal Online Services Ltd's latest Q3 FY26 results are concerning, showing a revenue of ₹13.21 crores but a net loss of ₹0.01 crores and negative operating profit, indicating ongoing financial struggles despite the return to sales. Overall, the results reflect significant operational challenges and can be considered bad.

Laddu Gopal Online Services Ltd's latest results for Q3 FY26 indicate a challenging situation for the company. While it recorded revenue of ₹13.21 crores, marking its first sales in seven quarters, it still posted a net loss of ₹0.01 crores. This loss is particularly concerning given that the company had shown positive net profits in the previous two quarters, albeit with zero revenue during those periods.<BR><BR>The operating profit before depreciation, interest, and tax (PBDIT) was negative ₹0.02 crores, highlighting ongoing struggles with profitability despite the revenue recognition. The return on equity (ROE) is extremely low at 0.64%, indicating poor capital efficiency, and the stock has dramatically underperformed, declining 66.40% over the past year.<BR><BR>Overall, while the reappearance of revenue is a positive sign, the continued losses and operational inefficiencies suggest that the results are more indicative of ongoing struggles rather than a turnaround. Therefore, the latest results can be considered bad, reflecting significant operational and financial challenges.

View full answer

How has been the historical performance of Laddu Gopal?

20-Nov-2025

Laddu Gopal's historical performance has been volatile, with net sales rising from 35.04 Cr in Mar'15 to 44.73 Cr in Mar'16, but facing significant losses, including a profit before tax of -14.31 Cr in Mar'16 due to rising costs and decreased operating profit. Total assets and liabilities increased, indicating a growing financial burden despite some sales growth.

Answer:<BR>The historical performance of Laddu Gopal shows significant fluctuations in key financial metrics over the years.<BR><BR>Breakdown:<BR>Laddu Gopal's net sales increased from 35.04 Cr in Mar'15 to 44.73 Cr in Mar'16, following a dip in Mar'14 to 40.56 Cr and a slight decline in Mar'13 to 43.87 Cr. Total operating income mirrored this trend, reaching 44.73 Cr in Mar'16, up from 35.04 Cr in Mar'15. However, the company faced rising raw material costs, which surged to 16.77 Cr in Mar'16 from 5.90 Cr in Mar'15. The total expenditure also rose significantly to 41.87 Cr in Mar'16, compared to 30.64 Cr in Mar'15. Consequently, operating profit (PBDIT) decreased to 3.93 Cr in Mar'16 from 5.10 Cr in Mar'15, leading to a profit before tax of -14.31 Cr in Mar'16, a stark contrast to the profit of 1.16 Cr in Mar'15. The profit after tax also fell to -13.87 Cr in Mar'16 from 0.52 Cr in Mar'15. The company's total assets increased to 316.61 Cr in Mar'16 from 188.55 Cr in Mar'15, while total liabilities rose to 316.61 Cr in Mar'16 from 188.55 Cr in Mar'15, indicating a growing financial burden. Cash flow from operating activities decreased to 3.00 Cr in Mar'16 from 15.00 Cr in Mar'15, reflecting challenges in maintaining liquidity. Overall, the financial performance of Laddu Gopal has shown volatility, with significant losses in recent years despite some growth in sales and assets.

View full answer

Who are the top shareholders of the Laddu Gopal?

17-Jul-2025

The top shareholders of Laddu Gopal are primarily individual investors, holding 89.24% of the shares, with Nimit Jayendrabhai Shah as the largest public shareholder at 9.64%. There are no institutional investors or pledged promoter holdings.

The top shareholders of Laddu Gopal primarily consist of individual investors, who hold a significant 89.24% of the shares. The highest public shareholder is Nimit Jayendrabhai Shah, with a holding of 9.64%. There are no institutional investors or mutual funds involved, and there are no pledged promoter holdings. Overall, the shareholding is predominantly non-institutional.

View full answer

Is Laddu Gopal overvalued or undervalued?

09-Jun-2025

As of April 25, 2023, Laddu Gopal is considered risky and overvalued, with a PE Ratio of 55.56 and a negative EV to EBIT of -40.41%, significantly underperforming compared to peers like Flair Writing and Doms Industries, and has seen a 1-year return of -37.97% versus the Sensex's 7.61%.

As of 25 April 2023, the valuation grade for Laddu Gopal has moved from does not qualify to risky. The company is currently assessed as overvalued. Key ratios include a PE Ratio of 55.56, an EV to EBIT of -40.41, and a ROE of 3.08%. In comparison, peers such as Flair Writing, which is fairly valued, has a PE Ratio of 23.28 and an EV to EBITDA of 14.61, while Doms Industries, categorized as very expensive, has a PE Ratio of 72.62.<BR><BR>The significant disparity in valuation metrics suggests that Laddu Gopal's current price does not align with its financial performance, especially given its negative EV to EBIT and low ROCE of -1.02%. The company's recent stock performance has been lackluster, with a 1-year return of -37.97% compared to a 7.61% return for the Sensex, further reinforcing the notion that it is overvalued in the current market context.

View full answer

What is the technical trend for Laddu Gopal?

09-Jun-2025

As of May 30, 2025, the technical trend for Laddu Gopal is mildly bullish, supported by bullish MACD and Bollinger Bands, although momentum indicators like RSI show a lack of strong signals.

As of 30 May 2025, the technical trend for Laddu Gopal has changed from bullish to mildly bullish. The weekly MACD is bullish, while the monthly MACD is mildly bullish, indicating a positive but weakening momentum. The Bollinger Bands are bullish on both weekly and monthly time frames, suggesting that the price is maintaining strength within its range. Daily moving averages are bullish, supporting the short-term positive outlook. However, the RSI shows no signal on both weekly and monthly charts, indicating a lack of strong momentum. Dow Theory reflects a mildly bullish stance on the monthly chart, while the weekly shows no trend. Overall, the current technical stance is mildly bullish, driven primarily by the bullish signals from MACD and Bollinger Bands, despite the absence of strong momentum indicators.

View full answer

Has ETT Ltd declared dividend?

30-Apr-2025

No Dividend History Available

iScoreScore
Click here to find our call on this stock
Strong Sell
Sell
Hold
Buy
Strong Buy

Dashboard

1

Weak Long Term Fundamental Strength as the company has not declared results in the last 6 months

  • Company's ability to service its debt is weak with a poor EBIT to Interest (avg) ratio of -0.61
  • The company has reported losses. Due to this company has reported negative ROCE
2

Flat results in Dec 25

 
3

Risky - Negative EBITDA

4

Consistent Underperformance against the benchmark over the last 3 years

stock-summaryMojo Parameters

Mojo Parameters

Loading Valuation Snapshot...

Stock DNA

stock-summary
Industry

Realty

stock-summary
Market cap

INR 6 Cr (Micro Cap)

stock-summary
P/E

15.00

stock-summary
Industry P/E

42

stock-summary
Dividend Yield

0.00%

stock-summary
Debt Equity

-0.13

stock-summary
Return on Equity

0.64%

stock-summary
Price to Book

0.10

Revenue and Profits:
Net Sales:
13 Cr
(Quarterly Results - Dec 2025)
Net Profit:
0 Cr
stock-summaryTotal Returns
Total Returns (Price + Dividend) stock-summary
Dividend Yield (0%)
TimePeriod
Price Return
Dividend Return
Total Return
3 Months
-37.5%
0%
-37.5%
6 Months
-57.94%
0%
-57.94%
1 Year
-82.63%
0%
-82.63%
2 Years
-87.47%
0%
-87.47%
3 Years
-89.68%
0%
-89.68%
4 Years
-93.87%
0%
-93.87%
5 Years
-89.13%
0%
-89.13%

Laddu Gopal for the last several years.

Risk Adjusted Returns v/s stock-summary
Returns Beta
Icon
Beta has not been calculated since enough price history is not available
stock-summaryNews & Corporate Actions

News

Laddu Gopal Online Services Ltd Drops 7.69%: 9 Key Factors Driving the Decline

Announcements stock-summary

Voting Results Of The Extra Ordinary General Meeting Under Regulation 44(3) Of The SEBI (LODR) Regulations 2015

07-Aug-2026 | Source : BSE

Submission of Voting Results of EGM held on 5th August 2026

Submission Of Scrutinizers Report Of The Extra Ordinary General Meeting (EGM) Held On 5Th August 2026

07-Aug-2026 | Source : BSE

Submission of Consolidated Scrutinizers Report of EGM held on 5th August 2026

Announcement under Regulation 30 (LODR)-Resignation of Company Secretary / Compliance Officer

06-Aug-2026 | Source : BSE

Intimation of Resignation of Company Secretary and Compliance Officer

Corporate Actions stock-summary

stock-summary
BOARD MEETING

No Upcoming Board Meetings

stock-summary
DIVIDEND

No Dividend history available

stock-summary
SPLITS

Laddu Gopal Online Services Ltd has announced 2:10 stock split, ex-date: 24 Jun 25

stock-summary
BONUS

No Bonus history available

stock-summary
RIGHTS

Laddu Gopal Online Services Ltd has announced 8:5 rights issue, ex-date: 11 Feb 25

stock-summaryKey Factors

Quality key factors stock-summary

Factor
Value
Sales Growth (5y)
35.80%
EBIT Growth (5y)
-7.38%
EBIT to Interest (avg)
-0.61
Debt to EBITDA (avg)
4.25
Net Debt to Equity (avg)
-0.13
Sales to Capital Employed (avg)
0.08
Tax Ratio
58.51%
Dividend Payout Ratio
0
Pledged Shares
0
Institutional Holding
0
ROCE (avg)
-1.40%
ROE (avg)
2.30%

Valuation key factors

Factor
Value
P/E Ratio
15
Industry P/E
42
Price to Book Value
0.10
EV to EBIT
1.30
EV to EBITDA
1.30
EV to Capital Employed
-0.04
EV to Sales
-0.15
PEG Ratio
NA
Dividend Yield
NA
ROCE (Latest)
Negative Capital Employed
ROE (Latest)
0.64%

Technicals key factors

Indicator
Weekly
Monthly
MACD
Mildly Bullish
Mildly Bullish
RSI
No Signal
Bullish
Bollinger Bands
Bearish
Mildly Bearish
Moving Averages
Bearish (Daily)
KST
Mildly Bullish
Bearish
Dow Theory
Mildly Bullish
No Trend
stock-summary Technical Indicator Scale: Bearish, Mildly Bearish, Sideways, Mildly Bullish, Bullish  Turned 
stock-summaryShareholding
Shareholding Snapshot : Jun 2026stock-summary
Shareholding Compare (%holding) stock-summary
Majority shareholders

Non Institution

Pledged Promoter Holdings

None

Mutual Funds

Held by 0 Schemes

FIIs

Held by 0 FIIs

Promoter with highest holding

None

Highest Public shareholder

Nimit Jayendrabhai Shah (6.06%)

Individual Investors Holdings

95.4%

stock-summaryFinancial
[
  {
    "link": "quarterly",
    "btn_text": "All Quarterly Results",
    "header": "Quarterly Results Snapshot (Standalone) - Dec'25 - QoQ",
    "rhs": [
      {
        "prefix": "Net Sales ",
        "suffix": "QoQ Growth in quarter ended Dec 2025 is 0.00% vs 0.00% in Sep 2025",
        "dir": 0
      },
      {
        "prefix": "Standalone Net Profit ",
        "suffix": "QoQ Growth in quarter ended Dec 2025 is -101.72% vs 38.10% in Sep 2025",
        "dir": -1
      }
    ],
    "table": {
      "header": [
        "Dec'25",
        "Sep'25",
        "Change(%)"
      ],
      "body": [
        {
          "field": "Net Sales",
          "val1": "13.21",
          "val2": "0.00",
          "chgp": "",
          "chgp_class": "neutral"
        },
        {
          "field": "Operating Profit (PBDIT) excl Other Income",
          "val1": "-0.02",
          "val2": "-0.07",
          "chgp": "71.43%",
          "chgp_class": "positive"
        },
        {
          "field": "Interest",
          "val1": "0.00",
          "val2": "0.00",
          "chgp": "",
          "chgp_class": "neutral"
        },
        {
          "field": "Exceptional Items",
          "val1": "0.00",
          "val2": "0.00",
          "chgp": "",
          "chgp_class": "neutral"
        },
        {
          "field": "Standalone Net Profit",
          "val1": "-0.01",
          "val2": "0.58",
          "chgp": "-101.72%",
          "chgp_class": "negative"
        },
        {
          "field": "Operating Profit Margin (Excl OI)",
          "val1": "-0.15%",
          "val2": "0.00%",
          "chgp": "-0.15%",
          "chgp_class": "negative"
        }
      ]
    }
  },
  {
    "link": "half-yearly",
    "btn_text": "All Half Yearly Results",
    "header": "Half Yearly Results Snapshot (Standalone) - Sep'25",
    "rhs": [
      {
        "prefix": "Net Sales ",
        "suffix": " Growth in half year ended Sep 2025 is 0.00% vs 0.00% in Sep 2024",
        "dir": 0
      },
      {
        "prefix": "Standalone Net Profit ",
        "suffix": " Growth in half year ended Sep 2025 is -15.83% vs 31.87% in Sep 2024",
        "dir": -1
      }
    ],
    "table": {
      "header": [
        "Sep'25",
        "Sep'24",
        "Change(%)"
      ],
      "body": [
        {
          "field": "Net Sales",
          "val1": "0.00",
          "val2": "0.00",
          "chgp": "",
          "chgp_class": "neutral"
        },
        {
          "field": "Operating Profit (PBDIT) excl Other Income",
          "val1": "-0.25",
          "val2": "-0.10",
          "chgp": "-150.00%",
          "chgp_class": "negative"
        },
        {
          "field": "Interest",
          "val1": "0.00",
          "val2": "0.00",
          "chgp": "",
          "chgp_class": "neutral"
        },
        {
          "field": "Exceptional Items",
          "val1": "0.00",
          "val2": "0.00",
          "chgp": "",
          "chgp_class": "neutral"
        },
        {
          "field": "Standalone Net Profit",
          "val1": "1.01",
          "val2": "1.20",
          "chgp": "-15.83%",
          "chgp_class": "negative"
        },
        {
          "field": "Operating Profit Margin (Excl OI)",
          "val1": "0.00%",
          "val2": "0.00%",
          "chgp": "NA",
          "chgp_class": "neutral"
        }
      ]
    }
  },
  {
    "link": "nine-monthly",
    "btn_text": "All Nine Monthly Results",
    "header": "Nine Monthly Results Snapshot (Standalone) - Dec'25",
    "rhs": [
      {
        "prefix": "Net Sales ",
        "suffix": "YoY Growth in nine months ended Dec 2025 is 0.00% vs 0.00% in Dec 2024",
        "dir": 0
      },
      {
        "prefix": "Standalone Net Profit ",
        "suffix": "YoY Growth in nine months ended Dec 2025 is -42.20% vs 29.10% in Dec 2024",
        "dir": -1
      }
    ],
    "table": {
      "header": [
        "Dec'25",
        "Dec'24",
        "Change(%)"
      ],
      "body": [
        {
          "field": "Net Sales",
          "val1": "13.21",
          "val2": "0.00",
          "chgp": "",
          "chgp_class": "neutral"
        },
        {
          "field": "Operating Profit (PBDIT) excl Other Income",
          "val1": "-0.27",
          "val2": "-0.35",
          "chgp": "22.86%",
          "chgp_class": "positive"
        },
        {
          "field": "Interest",
          "val1": "0.00",
          "val2": "0.00",
          "chgp": "",
          "chgp_class": "neutral"
        },
        {
          "field": "Exceptional Items",
          "val1": "0.00",
          "val2": "0.00",
          "chgp": "",
          "chgp_class": "neutral"
        },
        {
          "field": "Standalone Net Profit",
          "val1": "1.00",
          "val2": "1.73",
          "chgp": "-42.20%",
          "chgp_class": "negative"
        },
        {
          "field": "Operating Profit Margin (Excl OI)",
          "val1": "-2.04%",
          "val2": "0.00%",
          "chgp": "-2.04%",
          "chgp_class": "negative"
        }
      ]
    }
  },
  {
    "link": "annual",
    "btn_text": "All Annual Results",
    "header": "Annual Results Snapshot (Standalone) - Mar'25",
    "rhs": [
      {
        "prefix": "Net Sales ",
        "suffix": "YoY Growth in year ended Mar 2025 is 0.00% vs -100.00% in Mar 2024",
        "dir": 1
      },
      {
        "prefix": "Standalone Net Profit ",
        "suffix": "YoY Growth in year ended Mar 2025 is -30.64% vs -79.65% in Mar 2024",
        "dir": 1
      }
    ],
    "table": {
      "header": [
        "Mar'25",
        "Mar'24",
        "Change(%)"
      ],
      "body": [
        {
          "field": "Net Sales",
          "val1": "0.00",
          "val2": "0.00",
          "chgp": "",
          "chgp_class": "neutral"
        },
        {
          "field": "Operating Profit (PBDIT) excl Other Income",
          "val1": "-1.57",
          "val2": "-0.39",
          "chgp": "-302.56%",
          "chgp_class": "negative"
        },
        {
          "field": "Interest",
          "val1": "0.04",
          "val2": "0.00",
          "chgp": "",
          "chgp_class": "neutral"
        },
        {
          "field": "Exceptional Items",
          "val1": "0.00",
          "val2": "0.00",
          "chgp": "",
          "chgp_class": "neutral"
        },
        {
          "field": "Standalone Net Profit",
          "val1": "1.20",
          "val2": "1.73",
          "chgp": "-30.64%",
          "chgp_class": "negative"
        },
        {
          "field": "Operating Profit Margin (Excl OI)",
          "val1": "0.00%",
          "val2": "0.00%",
          "chgp": "NA",
          "chgp_class": "neutral"
        }
      ]
    }
  }
]

Quarterly Results Snapshot (Standalone) - Dec'25 - QoQstock-summary

Dec'25
Sep'25
Change(%)
Net Sales
13.21
0.00
Operating Profit (PBDIT) excl Other Income
-0.02
-0.07
71.43%
Interest
0.00
0.00
Exceptional Items
0.00
0.00
Standalone Net Profit
-0.01
0.58
-101.72%
Operating Profit Margin (Excl OI)
-0.15%
0.00%
-0.15%
Values in Rs Cr.
Net Sales

QoQ Growth in quarter ended Dec 2025 is 0.00% vs 0.00% in Sep 2025

Direction Arrows
Standalone Net Profit

QoQ Growth in quarter ended Dec 2025 is -101.72% vs 38.10% in Sep 2025

Half Yearly Results Snapshot (Standalone) - Sep'25stock-summary

Sep'25
Sep'24
Change(%)
Net Sales
0.00
0.00
Operating Profit (PBDIT) excl Other Income
-0.25
-0.10
-150.00%
Interest
0.00
0.00
Exceptional Items
0.00
0.00
Standalone Net Profit
1.01
1.20
-15.83%
Operating Profit Margin (Excl OI)
0.00%
0.00%
NA
Values in Rs Cr.
Net Sales

Growth in half year ended Sep 2025 is 0.00% vs 0.00% in Sep 2024

Direction Arrows
Standalone Net Profit

Growth in half year ended Sep 2025 is -15.83% vs 31.87% in Sep 2024

Nine Monthly Results Snapshot (Standalone) - Dec'25stock-summary

Dec'25
Dec'24
Change(%)
Net Sales
13.21
0.00
Operating Profit (PBDIT) excl Other Income
-0.27
-0.35
22.86%
Interest
0.00
0.00
Exceptional Items
0.00
0.00
Standalone Net Profit
1.00
1.73
-42.20%
Operating Profit Margin (Excl OI)
-2.04%
0.00%
-2.04%
Values in Rs Cr.
Net Sales

YoY Growth in nine months ended Dec 2025 is 0.00% vs 0.00% in Dec 2024

Direction Arrows
Standalone Net Profit

YoY Growth in nine months ended Dec 2025 is -42.20% vs 29.10% in Dec 2024

Annual Results Snapshot (Standalone) - Mar'25stock-summary

Mar'25
Mar'24
Change(%)
Net Sales
0.00
0.00
Operating Profit (PBDIT) excl Other Income
-1.57
-0.39
-302.56%
Interest
0.04
0.00
Exceptional Items
0.00
0.00
Standalone Net Profit
1.20
1.73
-30.64%
Operating Profit Margin (Excl OI)
0.00%
0.00%
NA
Values in Rs Cr.
Direction Arrows
Net Sales

YoY Growth in year ended Mar 2025 is 0.00% vs -100.00% in Mar 2024

Direction Arrows
Standalone Net Profit

YoY Growth in year ended Mar 2025 is -30.64% vs -79.65% in Mar 2024

stock-summaryCompany CV
About Laddu Gopal Online Services Ltd stock-summary
stock-summary
Laddu Gopal Online Services Ltd
Micro Cap
Realty
Laddu Gopal Online Services Limited was initially established as 'Indian Express Multi Media Limited' in November 1993. Name of the Company was changed from Indian Express Multi Media Limited to ETT Limited in June 2007. The Company has obtained shareholders' approval for the change of its name from "ETT Limited' to "Laddu Gopal Online Services Limited" with effect from May 15, 2025.
Company Coordinates stock-summary
Company Details
No 17 Hemkunt Colony , New Delhi New Delhi : 110048
stock-summary
Tel: 91-011-46567575
stock-summary
secretarial@ettgroup.in
Registrar Details
Beetal Financial & Computer Services (P) Ltd , Beetal House , 99 Mandangir, 3rd Floor, Behind Local Shopping Centre, Near Dada Harsukhdas Mandir, New Delhi