
Compare Laird Superfood, Inc. with Similar Stocks
Total Returns (Price + Dividend) 
Laird Superfood, Inc. for the last several years.
Risk Adjusted Returns v/s
News
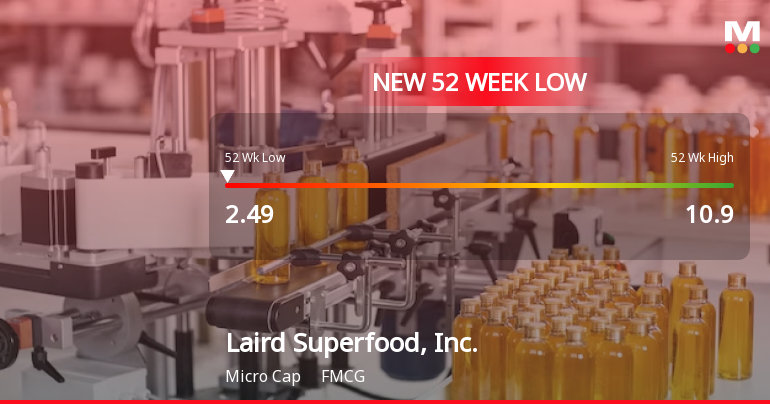
Laird Superfood Stock Hits 52-Week Low at $2.49 Amid Decline
Laird Superfood, Inc. has hit a new 52-week low, reflecting a challenging year with a significant stock price decline. The company, classified as a microcap with a market capitalization of approximately USD 61 million, is currently operating at a loss and exhibits complex financial metrics.
Read full news article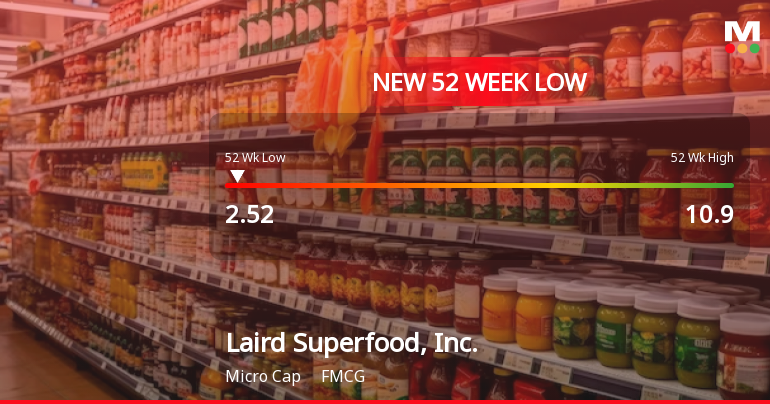
Laird Superfood Hits 52-Week Low at $2.52 Amidst Market Struggles
Laird Superfood, Inc. has hit a new 52-week low, reflecting significant challenges over the past year, with its stock down notably compared to the broader market. The company, with a market cap of around USD 61 million, faces financial difficulties, including negative return on equity and no reported P/E ratio.
Read full news article
Laird Superfood Hits New 52-Week Low at $2.67 Amid Declining Performance
Laird Superfood, Inc. has reached a new 52-week low, reflecting significant challenges over the past year, with its stock down substantially compared to the S&P 500. The company, with a market cap of around USD 61 million, shows negative return on equity and a reliance on external financing, focusing on growth rather than dividends.
Read full news article Announcements

Corporate Actions
Quality key factors
Valuation key factors
Technicals key factors
 Technical Indicator Scale: Bearish, Mildly Bearish, Sideways, Mildly Bullish, Bullish Turned
 Shareholding Snapshot : Sep 2025
Shareholding Compare (%holding)
Domestic Funds
Held in 7 Schemes (5.51%)
Held by 13 Foreign Institutions (3.59%)
Quarterly Results Snapshot (Consolidated) - Jun'25 - QoQ

QoQ Growth in quarter ended Jun 2025 is 2.56% vs 0.86% in Mar 2025

QoQ Growth in quarter ended Jun 2025 is -100.00% vs 50.00% in Mar 2025
Annual Results Snapshot (Consolidated) - Dec'24
YoY Growth in year ended Dec 2024 is 26.61% vs -4.47% in Dec 2023
YoY Growth in year ended Dec 2024 is 82.35% vs 74.69% in Dec 2023
About Laird Superfood, Inc.

Company Coordinates


