
Compare Lakhotia Poly. with Similar Stocks
Dashboard
With a Operating Losses, the company has a Weak Long Term Fundamental Strength
- Low ability to service debt as the company has a high Debt to EBITDA ratio of -16.33 times
- The company has been able to generate a Return on Capital Employed (avg) of 0.22% signifying low profitability per unit of total capital (equity and debt)
The company has declared Negative results for the last 3 consecutive quarters
Risky - Negative EBITDA
Stock DNA
Garments & Apparels
INR 67 Cr (Micro Cap)
28.00
26
0.00%
0.92
13.41%
3.68
Total Returns (Price + Dividend) 
Lakhotia Poly. for the last several years.
Risk Adjusted Returns v/s
Returns Beta

News
Are Lakhotia Polyesters (India) Ltd latest results good or bad?
Lakhotia Polyesters (India) Ltd's latest financial results for Q1 FY27 reveal significant operational challenges. The company reported net sales of ₹3.22 crores, which reflects a substantial year-on-year increase of 212.62% from the previous year's low of ₹1.03 crores. However, this figure represents a dramatic sequential decline of 71.63% from the preceding quarter's sales of ₹11.35 crores, indicating extreme volatility in revenue generation. The net profit for the quarter was ₹0.45 crores, marking a year-on-year decline of 54.08% and a staggering sequential drop of 88.66% from ₹3.97 crores in Q4 FY26. This decline raises concerns about the sustainability of profitability, particularly as the reported net profit was heavily reliant on ₹0.95 crores in other income, which masked an operating loss of ₹0.19 crores from core operations. The operating profit margin, excluding other income, stood at a negative 5...
Read full news article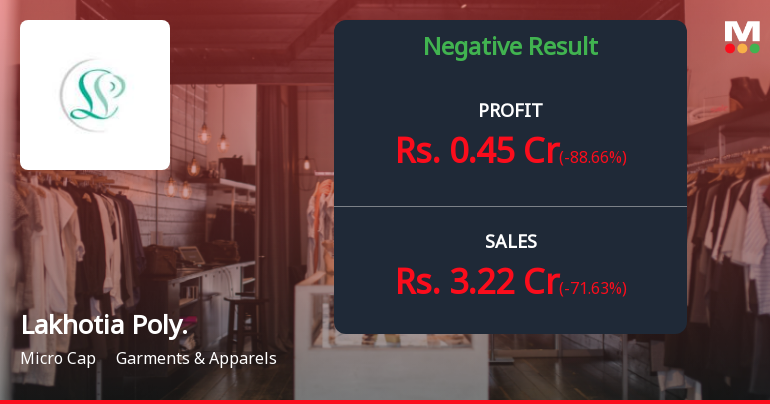
Lakhotia Polyesters Q1 FY27: Profit Plunge Amid Revenue Volatility Raises Sustainability Concerns
Lakhotia Polyesters (India) Ltd., a micro-cap garments and apparels manufacturer, reported a precipitous 54.08% quarter-on-quarter decline in net profit to ₹0.45 crores for Q1 FY27, down from ₹0.98 crores in Q1 FY26. The company's revenue trajectory remains highly erratic, with net sales plummeting 71.63% sequentially to ₹3.22 crores from ₹11.35 crores in Q4 FY26, though showing a 212.62% year-on-year surge from the abnormally low ₹1.03 crores base in Q1 FY25. Trading at ₹63.00 with a market capitalisation of ₹67.00 crores, the stock faces mounting questions about operational consistency and earnings quality.
Read full news article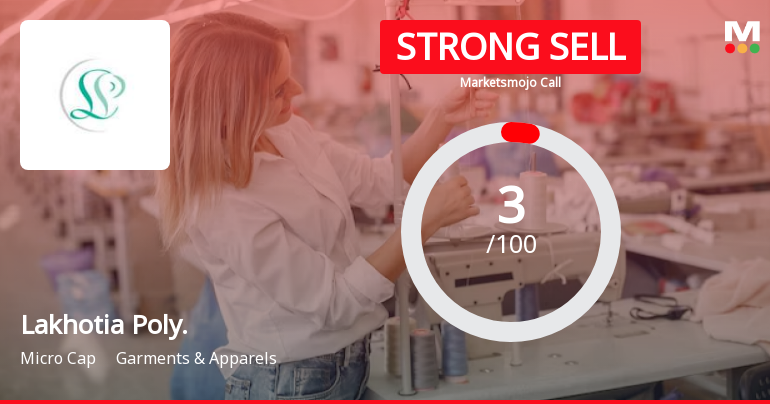
Lakhotia Polyesters (India) Ltd is Rated Strong Sell
Lakhotia Polyesters (India) Ltd is rated Strong Sell by MarketsMOJO. This rating was last updated on 19 Jan 2026, reflecting a shift from the previous 'Sell' grade. However, the analysis below is based on the company's current fundamentals, returns, and financial metrics as of 10 July 2026, providing investors with an up-to-date perspective on the stock's position.
Read full news article Announcements
Announcement under Regulation 30 (LODR)-Change in Directorate
17-Jul-2026 | Source : BSEAppointment of Ms. Kajal Dubey as an Independent Director and Resgination of Mr. Nikunj Shrawan Bihani as an Independent Director
Un-Audited Financial Results Of The Company For The Quarter Ended June 30 2026
17-Jul-2026 | Source : BSEUn-audited Financial Results of the Company for the quarter ended June 30 2026
Announcement under Regulation 30 (LODR)-Resignation of Director
17-Jul-2026 | Source : BSEResgination of Mr. Nikunj Shrawan Bihani as an Non-Executive Independent Director of the Company
Corporate Actions

No Upcoming Board Meetings

No Dividend history available

No Splits history available

Lakhotia Polyesters (India) Ltd has announced 18:10 bonus issue, ex-date: 25 Jul 14

No Rights history available
Quality key factors
Valuation key factors
Technicals key factors
 Technical Indicator Scale: Bearish, Mildly Bearish, Sideways, Mildly Bullish, Bullish Turned
 Shareholding Snapshot : Mar 2026
Shareholding Compare (%holding)
Promoters
None
Held by 0 Schemes
Held by 0 FIIs
Madhusudan Shamsundar Lakhotiya (44.57%)
Intensive Finance Private Limited (8.96%)
10.6%
Quarterly Results Snapshot (Standalone) - Jun'26 - QoQ

QoQ Growth in quarter ended Jun 2026 is -71.63% vs 49.93% in Mar 2026
QoQ Growth in quarter ended Jun 2026 is -88.66% vs 501.52% in Mar 2026
Half Yearly Results Snapshot (Standalone) - Sep'25
Growth in half year ended Sep 2025 is -66.58% vs 254.78% in Sep 2024
Growth in half year ended Sep 2025 is 64.58% vs 4,900.00% in Sep 2024
Nine Monthly Results Snapshot (Standalone) - Dec'25
YoY Growth in nine months ended Dec 2025 is -67.93% vs 115.30% in Dec 2024
YoY Growth in nine months ended Dec 2025 is 9.27% vs 606.90% in Dec 2024
Annual Results Snapshot (Standalone) - Mar'26
YoY Growth in year ended Mar 2026 is -73.81% vs 117.91% in Mar 2025
YoY Growth in year ended Mar 2026 is -60.47% vs 8,500.00% in Mar 2025
About Lakhotia Polyesters (India) Ltd

Company Coordinates


