
Compare Lak. Electrical with Similar Stocks
Dashboard
Poor Management Efficiency with a low ROE of 4.96%
- The company has been able to generate a Return on Equity (avg) of 4.96% signifying low profitability per unit of shareholders funds
Poor long term growth as Operating profit has grown by an annual rate -207.87% of over the last 5 years
Negative results in Mar 26
Risky - Negative Operating Profits
Consistent Underperformance against the benchmark over the last 3 years
Stock DNA
Other Electrical Equipment
INR 183 Cr (Micro Cap)
155.00
44
0.53%
0.03
0.44%
0.68
Total Returns (Price + Dividend) 
Latest dividend: 4 per share ex-dividend date: Aug-18-2025
Risk Adjusted Returns v/s
Returns Beta

News

Lakshmi Electrical Control Systems Ltd is Rated Strong Sell
Lakshmi Electrical Control Systems Ltd is rated Strong Sell by MarketsMOJO. This rating was last updated on 30 January 2026, reflecting a shift from the previous 'Sell' grade. However, the analysis and financial metrics discussed below represent the stock's current position as of 31 May 2026, providing investors with the latest insights into its performance and outlook.
Read full news articleAre Lakshmi Electrical Control Systems Ltd latest results good or bad?
Lakshmi Electrical Control Systems Ltd's latest financial results for Q4 FY26 reveal a complex picture characterized by significant revenue growth alongside substantial declines in profitability metrics. The company reported net sales of ₹68.47 crores, reflecting a year-on-year growth of 17.85%. This growth in revenue is notable; however, it is overshadowed by a sharp decline in net profit, which fell to ₹1.19 crores, representing a decrease of 55.90% compared to the same quarter last year. The operating profit, excluding other income, also saw a considerable contraction, dropping to ₹1.37 crores from ₹3.29 crores in the previous year, marking a decline of 58.36%. This resulted in an operating margin of 2.0%, down from 5.66% a year ago, indicating significant cost pressures and operational inefficiencies despite the revenue increase. The company's profit before tax, excluding other income, was notably low ...
Read full news article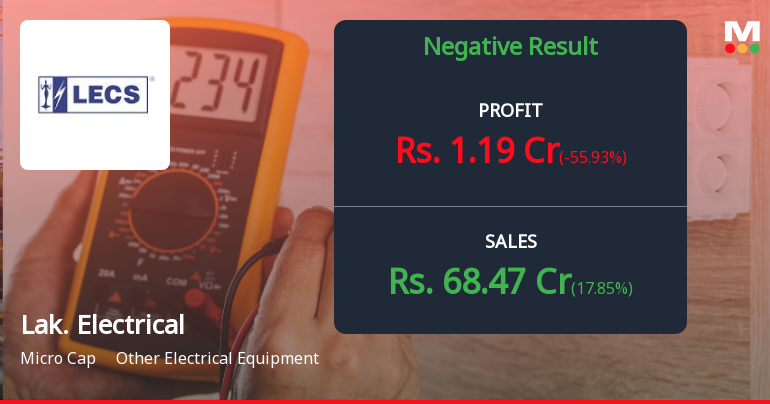
Lakshmi Electrical Control Systems Q4 FY26: Profitability Collapse Raises Serious Concerns
Lakshmi Electrical Control Systems Ltd., a Coimbatore-based manufacturer of control panels and plastic components, reported deeply troubling Q4 FY26 results that expose severe operational challenges despite revenue growth. Net profit collapsed 55.90% year-on-year to ₹1.19 crores from ₹2.70 crores in Q4 FY25, whilst the stock tumbled 2.43% following the announcement, trading at ₹815.00 against a market capitalisation of ₹200.33 crores.
Read full news article Announcements
Clarification Regarding Query On Corporate Announcement Filed Under Regulation 30
04-Jun-2026 | Source : BSEClarification regarding query on Corporate Announcement filed under Regulation 30
GST Notice
02-Jun-2026 | Source : BSEGST Notice
Announcement under Regulation 30 (LODR)-Newspaper Publication
29-May-2026 | Source : BSENewspaper publication - IEPF related
Corporate Actions

No Upcoming Board Meetings

Lakshmi Electrical Control Systems Ltd has declared 30% dividend, ex-date: 24 Jul 26

No Splits history available

No Bonus history available

No Rights history available
Quality key factors
Valuation key factors
Technicals key factors
 Technical Indicator Scale: Bearish, Mildly Bearish, Sideways, Mildly Bullish, Bullish Turned
 Shareholding Snapshot : Mar 2026
Shareholding Compare (%holding)
Non Institution
None
Held by 1 Schemes (0.0%)
Held by 0 FIIs
Nethra J S Kumar (30.96%)
Fortress Advisors Llp (4.27%)
50.73%
Quarterly Results Snapshot (Standalone) - Mar'26 - YoY

YoY Growth in quarter ended Mar 2026 is 17.85% vs -6.21% in Mar 2025

YoY Growth in quarter ended Mar 2026 is -55.93% vs 29.81% in Mar 2025
Half Yearly Results Snapshot (Standalone) - Sep'25
Growth in half year ended Sep 2025 is 5.61% vs -46.18% in Sep 2024
Growth in half year ended Sep 2025 is 64.06% vs -93.57% in Sep 2024
Nine Monthly Results Snapshot (Standalone) - Dec'25
YoY Growth in nine months ended Dec 2025 is 9.66% vs -44.13% in Dec 2024
YoY Growth in nine months ended Dec 2025 is -100.00% vs -93.52% in Dec 2024
Annual Results Snapshot (Standalone) - Mar'26
YoY Growth in year ended Mar 2026 is 11.90% vs -37.18% in Mar 2025
YoY Growth in year ended Mar 2026 is -65.71% vs -75.14% in Mar 2025
About Lakshmi Electrical Control Systems Ltd

Company Coordinates


