
Compare Lakshmi Engg. with Similar Stocks
Stock DNA
Industrial Manufacturing
INR 149 Cr (Micro Cap)
94.00
92
0.42%
0.15
7.33%
6.98
Total Returns (Price + Dividend) 
Latest dividend: 10 per share ex-dividend date: Sep-11-2025
Risk Adjusted Returns v/s
Returns Beta

News
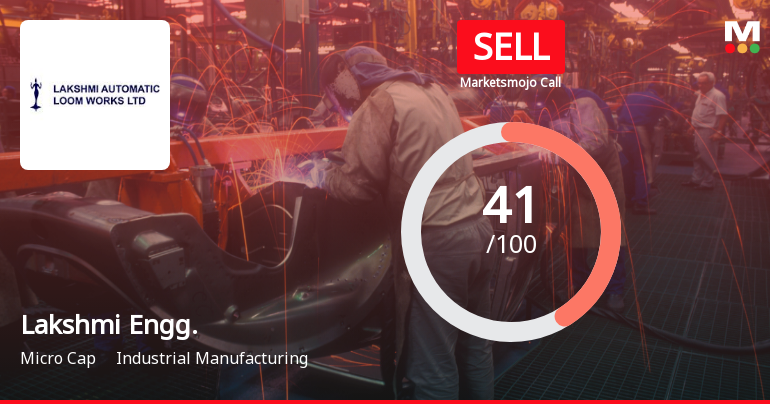
Lakshmi Engineering & Warehousing Ltd Downgraded to Sell Amid Mixed Financial and Technical Signals
Lakshmi Engineering & Warehousing Ltd, a micro-cap player in the industrial manufacturing sector, has seen its investment rating downgraded from Hold to Sell as of 17 June 2026. The revision reflects a combination of deteriorating technical indicators, expensive valuation metrics, flat financial trends, and subdued quality scores, signalling caution for investors amid mixed market signals and challenging fundamentals.
Read full news article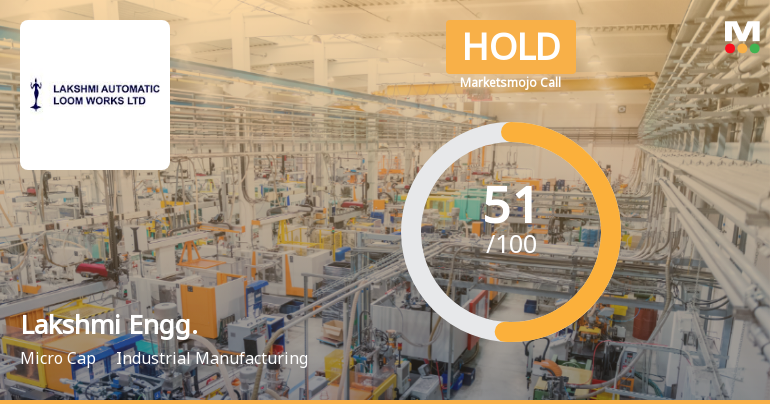
Lakshmi Engineering & Warehousing Ltd Upgraded to Hold on Technical and Valuation Improvements
Lakshmi Engineering & Warehousing Ltd has seen its investment rating upgraded from Sell to Hold, reflecting a shift in technical indicators and valuation metrics despite flat recent financial performance. The company’s improved technical trend, stable financial ratios, and relative valuation premium underpin this revised stance, signalling cautious optimism for investors in the industrial manufacturing sector.
Read full news article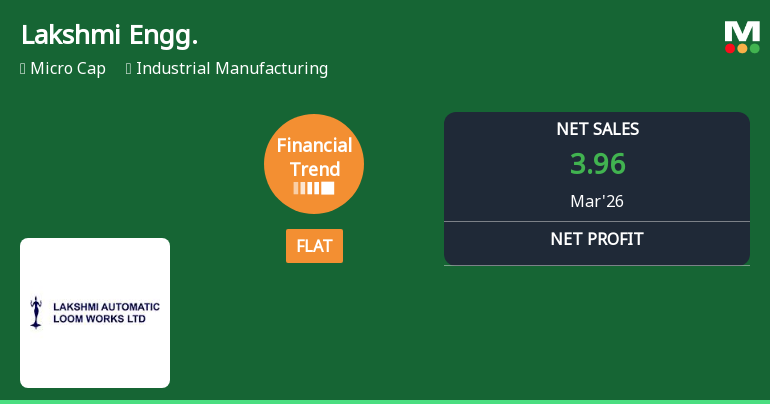
Lakshmi Engineering & Warehousing Ltd Reports Flat Quarterly Performance Amid Margin Pressures
Lakshmi Engineering & Warehousing Ltd, a micro-cap player in the industrial manufacturing sector, has reported a flat financial performance for the quarter ended March 2026, signalling a pause in its previously positive growth trajectory. Despite some operational improvements, the company faces challenges in inventory management and margin expansion, prompting a downgrade in its Mojo Grade from Hold to Sell as of 22 December 2025.
Read full news article Announcements
Intimation Of Record Date Pursuant To Regulation 42 Of SEBI (LODR) Regulations 2015 - Reg.
03-Jun-2026 | Source : BSEThe Record date for the payment of Divident for the Financial Year 2025-26 at Rs.10/- (10%) per share subject to the approval of the shareholders at the Annual General Meeting to be held on 10.08.2026.
Board Meeting Outcome for Outcome Of Board Meeting Held On 29.05.2026 And Disclosure Under SEBI (Listing Obligations And Disclosure Requirements) Regulations 2015.
29-May-2026 | Source : BSEThe Board of Directors of the Company at its meeting held on 29.05.2026 had inter-alia considered and approved the following: a. The Audited Financial Results for the quarter and year ended 31.03.2026. b. Independent Auditors Report Declaration Recommend a Payment of Dividend at 10% Reappointment of Pradip Roy for Second Term of 5 Years Fixed the date and time of AGM Co-opting Sri N.Jayachandar as an Additional Member of the Audit Committee.
Corporate Action-Board to consider Dividend
29-May-2026 | Source : BSEThis is to inform that Pursuant to Regulation 30(4) of the SEBI (Listing Obligations and Disclosure Requirement) Regulations 2015 the Board of Directors at their Meeting held on 29.05.2026 have recommended a dividend ofm Rs.10/- (10%) per equity share of Rs.100/- each for the year ended 31.03.2026.
Corporate Actions

No Upcoming Board Meetings

Lakshmi Engineering & Warehousing Ltd has declared 10% dividend, ex-date: 11 Sep 25

Lakshmi Engineering & Warehousing Ltd has announced 100:10 stock split, ex-date: 04 May 21

No Bonus history available

No Rights history available
Quality key factors
Valuation key factors
Technicals key factors
 Technical Indicator Scale: Bearish, Mildly Bearish, Sideways, Mildly Bullish, Bullish Turned
 Shareholding Snapshot : Mar 2026
Shareholding Compare (%holding)
Non Institution
None
Held by 0 Schemes
Held by 0 FIIs
Aishwarya Pathy (16.65%)
Itema (switzerland) Ltd (14.95%)
12.44%
Quarterly Results Snapshot (Standalone) - Mar'26 - YoY

YoY Growth in quarter ended Mar 2026 is 24.53% vs -2.75% in Mar 2025
YoY Growth in quarter ended Mar 2026 is 131.82% vs -51.11% in Mar 2025
Half Yearly Results Snapshot (Standalone) - Sep'25
Growth in half year ended Sep 2025 is 6.13% vs -12.23% in Sep 2024
Growth in half year ended Sep 2025 is 1.22% vs -36.92% in Sep 2024
Nine Monthly Results Snapshot (Standalone) - Dec'25
YoY Growth in nine months ended Dec 2025 is 7.90% vs -16.49% in Dec 2024
YoY Growth in nine months ended Dec 2025 is 85.71% vs -66.13% in Dec 2024
Annual Results Snapshot (Standalone) - Mar'26
YoY Growth in year ended Mar 2026 is 12.03% vs -13.46% in Mar 2025
YoY Growth in year ended Mar 2026 is 98.81% vs -63.64% in Mar 2025
About Lakshmi Engineering & Warehousing Ltd

Company Coordinates


