
Compare Lancer Containe. with Similar Stocks
Stock DNA
Transport Services
INR 360 Cr (Micro Cap)
69.00
36
0.00%
0.01
0.80%
0.52
Total Returns (Price + Dividend) 
Latest dividend: 0.027225000000000003 per share ex-dividend date: Sep-09-2021
Risk Adjusted Returns v/s
Returns Beta

News

Lancer Containers Lines Ltd is Rated Sell
Lancer Containers Lines Ltd is rated 'Sell' by MarketsMOJO, with this rating last updated on 30 May 2026. However, the analysis and financial metrics discussed here reflect the stock's current position as of 10 June 2026, providing investors with the latest insights into the company’s performance and outlook.
Read full news article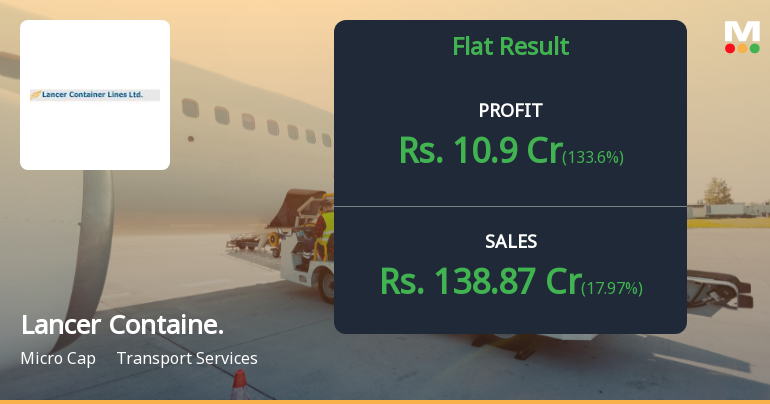
Lancer Container Lines Q4 FY26: Profit Surge Masks Deeper Operational Concerns
Lancer Container Lines Ltd., an integrated shipping and logistics solutions provider, reported a consolidated net profit of ₹10.90 crores for Q4 FY26, a dramatic turnaround from a loss of ₹7.43 crores in the previous quarter. However, the 133.60% year-on-year decline compared to Q4 FY25's ₹32.44 crore loss reveals a company still grappling with fundamental operational challenges despite the sequential recovery.
Read full news article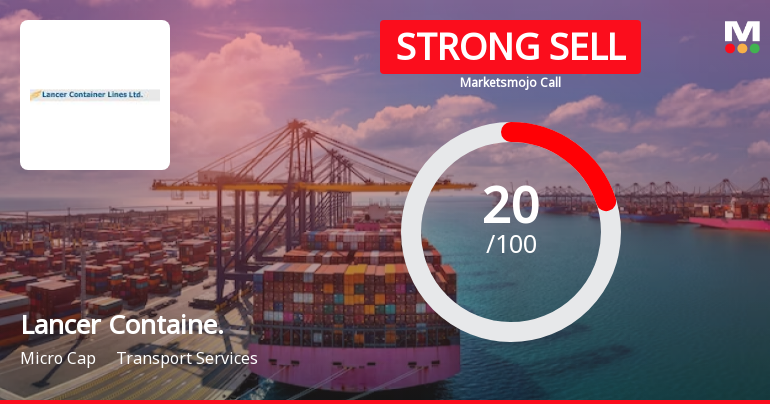
Lancer Containers Lines Ltd is Rated Strong Sell
Lancer Containers Lines Ltd is rated Strong Sell by MarketsMOJO, with this rating last updated on 09 Jan 2026. However, the analysis and financial metrics discussed here reflect the company’s current position as of 27 May 2026, providing investors with an up-to-date perspective on the stock’s fundamentals, valuation, financial trends, and technical outlook.
Read full news article Announcements
Shareholder Meeting / Postal Ballot-Scrutinizers Report
12-Jun-2026 | Source : BSEPlease find enclosed the Scrutinizers Report of 1st Postal Ballot of the Company for the Financial Year 2026-27.
Shareholder Meeting / Postal Ballot-Outcome of Postal_Ballot
12-Jun-2026 | Source : BSEPlease find enclosed the Voting Results of 1st Postal Ballot of the Company for the Financial Year 2026-27.
Disclosure Under Regulation 30 Of SEBI (Listing Obligations And Disclosure Requirements) Regulations 2015.
02-Jun-2026 | Source : BSEPlease find enclosed the disclosure under Regulation 30 of SEBI (Listing Obligations and Disclosure Requirements) Regulations 2015.
Corporate Actions

No Upcoming Board Meetings

Lancer Containers Lines Ltd has declared 5% dividend, ex-date: 09 Sep 21

Lancer Containers Lines Ltd has announced 5:10 stock split, ex-date: 16 Dec 22

Lancer Containers Lines Ltd has announced 2:1 bonus issue, ex-date: 22 Sep 23

No Rights history available
Quality key factors
Valuation key factors
Technicals key factors
 Technical Indicator Scale: Bearish, Mildly Bearish, Sideways, Mildly Bullish, Bullish Turned
 Shareholding Snapshot : Mar 2026
Shareholding Compare (%holding)
Non Institution
None
Held by 1 Schemes (1.64%)
Held by 3 FIIs (0.43%)
Abdulkhalik Chataiwala (25.21%)
Muhammed Noufal Balliyod Master Abdullakunhi (6.99%)
33.84%
Quarterly Results Snapshot (Consolidated) - Mar'26 - YoY

YoY Growth in quarter ended Mar 2026 is 17.97% vs -22.69% in Mar 2025
YoY Growth in quarter ended Mar 2026 is 133.60% vs -302.88% in Mar 2025
Half Yearly Results Snapshot (Consolidated) - Sep'25

Growth in half year ended Sep 2025 is -46.40% vs 13.29% in Sep 2024
Growth in half year ended Sep 2025 is -91.99% vs -5.26% in Sep 2024
Nine Monthly Results Snapshot (Consolidated) - Dec'25
YoY Growth in nine months ended Dec 2025 is -55.89% vs 20.24% in Dec 2024
YoY Growth in nine months ended Dec 2025 is -117.08% vs -27.04% in Dec 2024
Annual Results Snapshot (Consolidated) - Mar'26
YoY Growth in year ended Mar 2026 is -43.64% vs 10.38% in Mar 2025
YoY Growth in year ended Mar 2026 is 1,708.57% vs -100.60% in Mar 2025
About Lancer Containers Lines Ltd

Company Coordinates


