
Compare Landmark Cars with Similar Stocks
Dashboard
Weak Long Term Fundamental Strength with a -8.44% CAGR growth in Operating Profits over the last 5 years
- Low ability to service debt as the company has a high Debt to EBITDA ratio of 3.31 times
- The company has been able to generate a Return on Equity (avg) of 7.02% signifying low profitability per unit of shareholders funds
Consistent Underperformance against the benchmark over the last 3 years
Stock DNA
Automobiles
INR 1,748 Cr (Small Cap)
44.00
27
0.12%
1.40
6.83%
2.92
Total Returns (Price + Dividend) 
Latest dividend: 0.5 per share ex-dividend date: Sep-15-2025
Risk Adjusted Returns v/s
Returns Beta

News
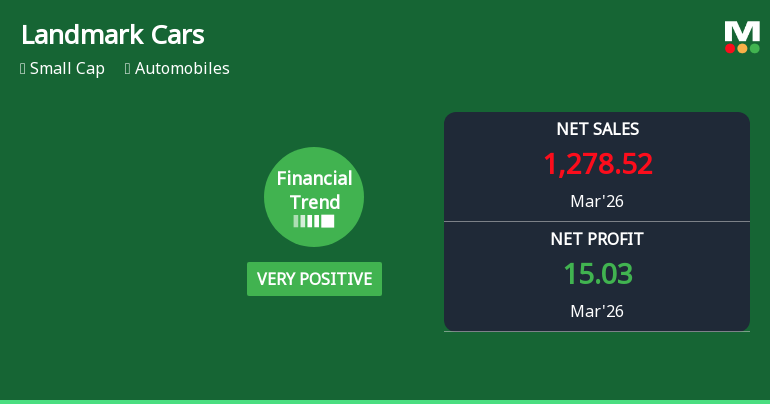
Landmark Cars Ltd Reports Positive Financial Trend Amid Market Challenges
Landmark Cars Ltd has demonstrated a notable improvement in its financial performance for the quarter ending March 2026, shifting its financial trend from very positive to positive. Despite a challenging market environment and a modest decline in year-to-date returns, the company’s key operational metrics and profitability indicators have reached new highs, signalling a potential turnaround in its business trajectory.
Read full news article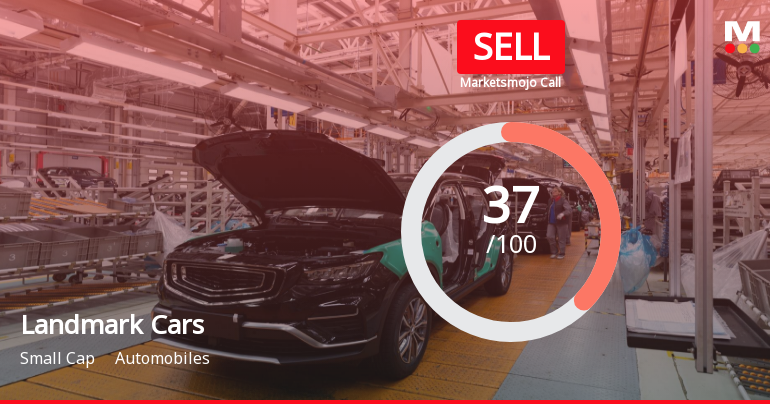
Landmark Cars Ltd is Rated Sell by MarketsMOJO
Landmark Cars Ltd is rated 'Sell' by MarketsMOJO, with this rating last updated on 10 Feb 2026. However, the analysis and financial metrics discussed here reflect the stock's current position as of 09 June 2026, providing investors with an up-to-date view of the company’s performance and outlook.
Read full news article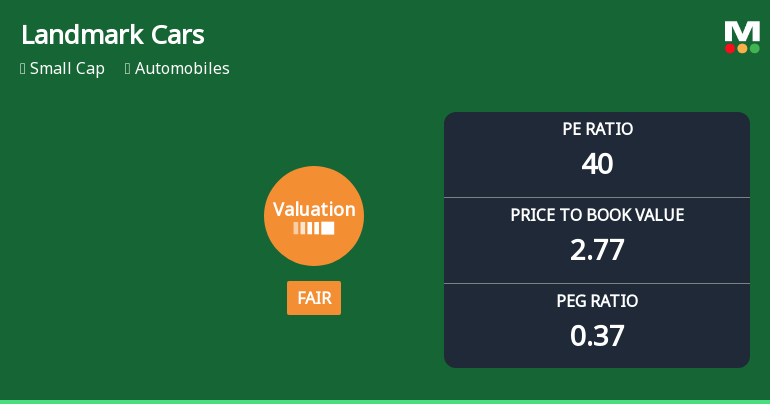
Landmark Cars Ltd Valuation Shifts to Fair Amid Mixed Market Performance
Landmark Cars Ltd, a small-cap player in the Indian automobile sector, has witnessed a notable shift in its valuation parameters, moving from an attractive to a fair valuation grade. Despite a recent day gain of 4.71%, the company’s price-to-earnings (P/E) and price-to-book value (P/BV) ratios suggest a more cautious outlook compared to historical and peer benchmarks. This article analyses the evolving valuation landscape for Landmark Cars, placing it in the context of sectoral trends and broader market performance.
Read full news article Announcements
Announcement under Regulation 30 (LODR)-Earnings Call Transcript
03-Jun-2026 | Source : BSELandmark Cars Limited submitted to the exchange the transcript of Earnings Conference Call held on May 27 2026 at 10:00 AM to discuss the Audited Standalone & Consolidated Financial results for the quarter and year ended March 31 2026. Disclosure is attached herewith.
Intimation Of Submission Of Application For Reclassification Of Person Forming Part Of The Promoter / Promoter Group From Promoter Group Category To Public Category Shareholder Of The Company Pursuant To Regulation 31A Of SEBI (LODR) Regulations 2015
03-Jun-2026 | Source : BSELandmark Cars Limited has submitted to the exchange about the filling of application with the stock exchanges on May 30 2026 for approval of reclassification from Promoter Group category to Public Category.
Announcement under Regulation 30 (LODR)-Analyst / Investor Meet - Intimation
02-Jun-2026 | Source : BSELandmark Cars Limited has informed the exchange that the officials of the Company will be meeting the Investors / Analysts (participants) as per attached details.
Corporate Actions

No Upcoming Board Meetings

Landmark Cars Ltd has declared 10% dividend, ex-date: 15 Sep 25

No Splits history available

No Bonus history available

No Rights history available
Quality key factors
Valuation key factors
Technicals key factors
 Technical Indicator Scale: Bearish, Mildly Bearish, Sideways, Mildly Bullish, Bullish Turned
 Shareholding Snapshot : Mar 2026
Shareholding Compare (%holding)
Promoters
None
Held by 5 Schemes (13.96%)
Held by 27 FIIs (5.05%)
Sanjay Karsandas Thakker (36.34%)
Nippon Life India Trustee Ltd-a/c Nippon India Small Cap Fund (7.5%)
19.0%
Quarterly Results Snapshot (Consolidated) - Mar'26 - QoQ

QoQ Growth in quarter ended Mar 2026 is -4.95% vs 11.08% in Dec 2025
QoQ Growth in quarter ended Mar 2026 is 5.99% vs 1,091.60% in Dec 2025
Half Yearly Results Snapshot (Consolidated) - Sep'25

Growth in half year ended Sep 2025 is 30.67% vs 18.75% in Sep 2024
Growth in half year ended Sep 2025 is 156.33% vs -88.38% in Sep 2024
Nine Monthly Results Snapshot (Consolidated) - Dec'25
YoY Growth in nine months ended Dec 2025 is 23.29% vs 21.06% in Dec 2024
YoY Growth in nine months ended Dec 2025 is 53.44% vs -68.04% in Dec 2024
Annual Results Snapshot (Consolidated) - Mar'26
YoY Growth in year ended Mar 2026 is 21.63% vs 22.43% in Mar 2025
YoY Growth in year ended Mar 2026 is 134.21% vs -71.56% in Mar 2025
About Landmark Cars Ltd

Company Coordinates


