
Compare Latent View with Similar Stocks
Dashboard
Falling Participation by Institutional Investors
- Institutional investors have decreased their stake by -0.64% over the previous quarter and collectively hold 7.28% of the company
- These investors have better capability and resources to analyse fundamentals of companies than most retail investors
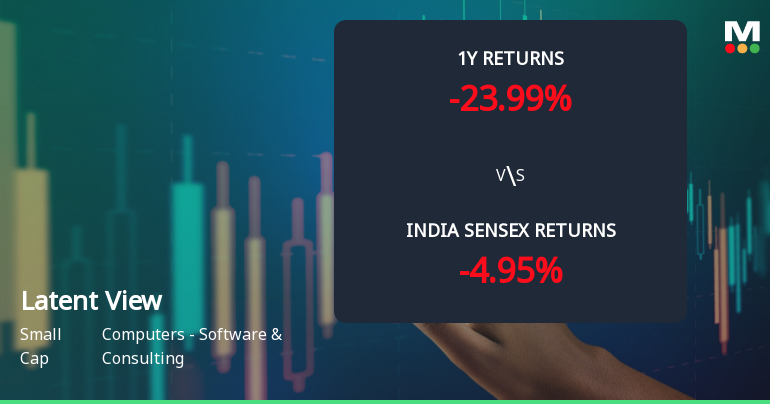
Underperformed the market in the last 1 year
Stock DNA
Computers - Software & Consulting
INR 6,096 Cr (Small Cap)
31.00
20
0.00%
-0.35
11.29%
3.62
Total Returns (Price + Dividend) 
Latent View for the last several years.
Risk Adjusted Returns v/s
Returns Beta

News
Latent View Analytics Ltd Sees Mixed Technical Signals Amid Price Momentum Shift
Latent View Analytics Ltd has experienced a notable shift in its technical momentum, with key indicators signalling a transition from bearish to mildly bearish trends. Despite a modest day gain of 1.94%, the company’s technical parameters reveal a complex picture of mixed signals across weekly and monthly timeframes, reflecting cautious investor sentiment in the Computers - Software & Consulting sector.
Read full news article
Latent View Analytics Ltd Faces Bearish Momentum Amid Technical Downgrade
Latent View Analytics Ltd, a small-cap player in the Computers - Software & Consulting sector, has experienced a notable shift in its technical momentum, prompting a downgrade in its Mojo Grade from Hold to Sell as of 20 Feb 2026. The stock’s recent price action and technical indicators suggest a bearish trend, reflecting challenges in regaining upward momentum amid broader market pressures.
Read full news article
Latent View Analytics Ltd Technical Momentum Shifts Amid Bearish Market Trends
Latent View Analytics Ltd, a small-cap player in the Computers - Software & Consulting sector, has experienced a nuanced shift in its technical momentum, reflecting a complex interplay of bullish and bearish signals. Despite a modest daily price increase of 0.58%, the stock’s broader technical indicators reveal a cautious outlook, with mixed signals from MACD, RSI, Bollinger Bands, and moving averages suggesting a transition from bearish to mildly bearish trends.
Read full news article Announcements
Announcement under Regulation 30 (LODR)-Change in Management
17-Jun-2026 | Source : BSEPursuant to Regulation 30 of the SEBI (Listing Obligation and Disclosure Requirements) Regulations 2015 as amended we wish to inform you the following : 1. Appointment of Ms. Sudha Sankaran (DIN: 01086489) as an Additional Director (Independent)of the company. 2. Completion of Ms. Dipali Sheths Term as an Independent Director of the company 3. Reconstitution of Nomination and Remuneration Committee
Announcement under Regulation 30 (LODR)-Analyst / Investor Meet - Intimation
09-Jun-2026 | Source : BSEPursuant to Regulation 30 of SEBI (Listing Obligations and Disclosure Requirements) Regulations 2015 please be informed of the schedule of Analysts /Institutional Investor meeting with the Company.
Announcement under Regulation 30 (LODR)-Earnings Call Transcript
25-May-2026 | Source : BSEPursuant to Regulation 30 of SEBI (Listing Obligations and Disclosure Requirements) Regulations 2015 please find enclosed the transcript of the Earnings Call held on Monday May 18 2026 post announcement of financial results of the company for the quarter and financial year ended March 31 2026.
Corporate Actions

No Upcoming Board Meetings

No Dividend history available

No Splits history available

No Bonus history available

No Rights history available
Quality key factors
Valuation key factors
Technicals key factors
 Technical Indicator Scale: Bearish, Mildly Bearish, Sideways, Mildly Bullish, Bullish Turned
 Shareholding Snapshot : Mar 2026
Shareholding Compare (%holding)
Promoters
None
Held by 22 Schemes (3.67%)
Held by 61 FIIs (3.15%)
Adugudi Viswanathan Venkatraman (56.98%)
Gopinath Koteeswaran (4.58%)
23.43%
Quarterly Results Snapshot (Consolidated) - Mar'26 - QoQ

QoQ Growth in quarter ended Mar 2026 is 3.82% vs 7.95% in Dec 2025
QoQ Growth in quarter ended Mar 2026 is 5.21% vs 12.95% in Dec 2025
Half Yearly Results Snapshot (Consolidated) - Sep'25
Growth in half year ended Sep 2025 is 27.26% vs 27.84% in Sep 2024

Growth in half year ended Sep 2025 is 20.83% vs 17.84% in Sep 2024
Nine Monthly Results Snapshot (Consolidated) - Dec'25
YoY Growth in nine months ended Dec 2025 is 25.32% vs 31.26% in Dec 2024
YoY Growth in nine months ended Dec 2025 is 20.43% vs 6.45% in Dec 2024
Annual Results Snapshot (Consolidated) - Mar'26
YoY Growth in year ended Mar 2026 is 25.05% vs 32.33% in Mar 2025
YoY Growth in year ended Mar 2026 is 13.74% vs 9.80% in Mar 2025
About Latent View Analytics Ltd

Company Coordinates


