
Compare Latent View with Similar Stocks
Dashboard
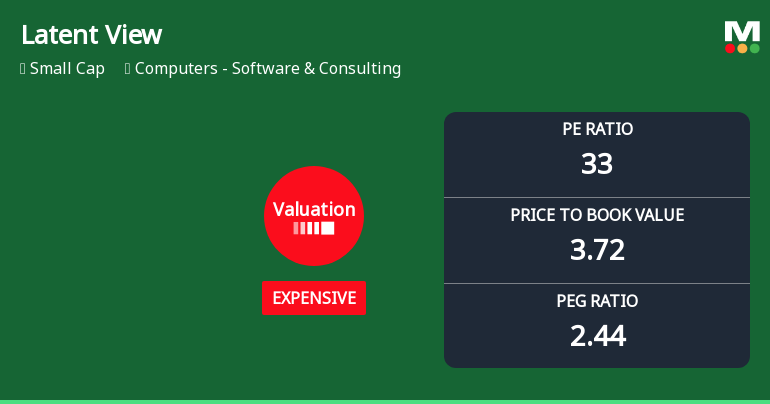
With ROE of 11.3, it has a Expensive valuation with a 3.7 Price to Book Value
- The stock is trading at a discount compared to its peers' average historical valuations
- Over the past year, while the stock has generated a return of -23.53%, its profits have risen by 13.7% ; the PEG ratio of the company is 2.4
Falling Participation by Institutional Investors
Underperformed the market in the last 1 year
Stock DNA
Computers - Software & Consulting
INR 6,642 Cr (Small Cap)
33.00
20
0.00%
-0.35
11.29%
3.72
Total Returns (Price + Dividend) 
Latent View for the last several years.
Risk Adjusted Returns v/s
Returns Beta

News
Latent View Analytics Ltd Valuation Shifts Signal Price Attractiveness Challenges
Latent View Analytics Ltd, a player in the Computers - Software & Consulting sector, has seen its valuation parameters shift notably, raising questions about its price attractiveness amid a challenging market backdrop. With a recent upgrade in its Mojo Grade from Hold to Sell and valuation metrics moving from fair to expensive, investors are urged to reassess the stock’s relative appeal compared to peers and historical benchmarks.
Read full news article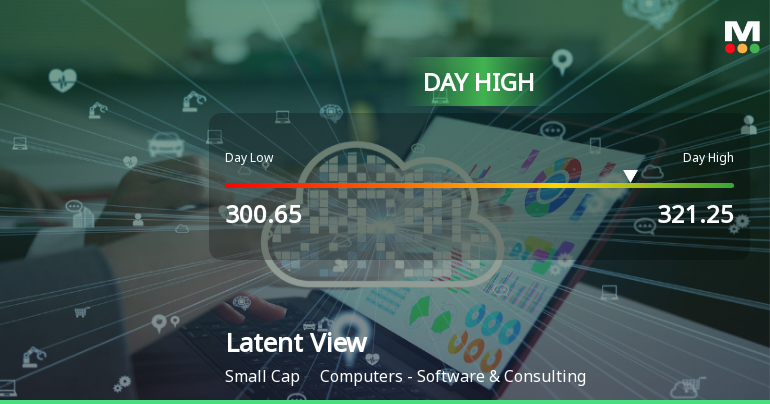
Latent View Analytics Ltd Surges 7.3% to Day's High of Rs 321.25 — Outperforms Sector by 5.26 Percentage Points
The Sensex advanced 0.9% on 27 Jul 2026, yet Latent View Analytics Ltd outpaced the broader market with a 7.3% gain, reaching an intraday high of Rs 321.25. This 5.26 percentage-point outperformance over the IT - Software sector’s 2.04% rise signals a distinctly stock-specific rally rather than a general market lift.
Read full news article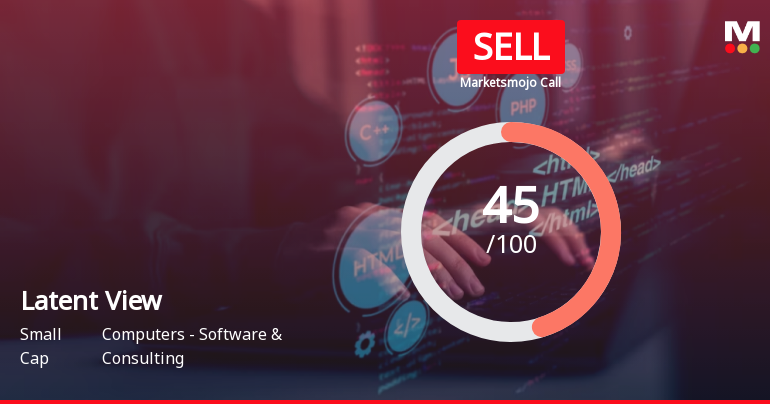
Latent View Analytics Ltd is Rated Sell
Latent View Analytics Ltd is rated 'Sell' by MarketsMOJO, with this rating last updated on 20 February 2026. However, the analysis and financial metrics discussed here reflect the stock's current position as of 27 July 2026, providing investors with an up-to-date view of the company’s fundamentals, valuation, financial trends, and technical outlook.
Read full news article Announcements
Board Meeting Intimation for Approval Of The Unaudited Standalone And Consolidated Financial Results Of The Company Prepared In Accordance With Indian Accounting Standards (Ind AS) For The Quarter Ended June 30 2026.
23-Jul-2026 | Source : BSELatent View Analytics Ltdhas informed BSE that the meeting of the Board of Directors of the Company is scheduled on 01/08/2026 inter alia to consider and approve the Unaudited Standalone and Consolidated Financial Results of the Company prepared in accordance with Indian Accounting Standards (Ind AS) for the quarter ended June 30 2026.
Disclosure Under Regulation 30 Of The SEBI (Listing Obligations And Disclosure Requirements) Regulations 2015 (SEBI Listing Regulations) - ESG Rating
22-Jul-2026 | Source : BSEPursuant to Regulation 30 of the SEBI Listing Regulations we wish to inform you that as per the communication made by Crisil ESG Rating & Analytics Ltd (Crisil ESG Ratings) on July 21 2026 the Company has been assigned an ESG Rating of 68. Please note that the Company has not engaged Crisil ESG Ratings for the ESG Ratings. Crisil ESG Ratings has independently prepared the report based on the data pertaining to the Company available in the public domain.
Announcement under Regulation 30 (LODR)-Cessation
22-Jul-2026 | Source : BSEPursuant to Regulation 30 of the SEBI (Listing Obligations and Disclosure Requirements) Regulations 2015 as amended we wish to inform you that Mr. Mukesh Butani (DIN: 01452839) completes his term of 5 (Five) consecutive years as an Independent Director and will consequently cease to be a Director on the Board of the Company effective from the close of business hours today i.e. July 22 2026. The Board and Management sincerely thank Mr. Mukesh Butani (DIN: 01452839) for his invaluable guidance and significant contribution during his tenure as an Independent Director of the Company.
Corporate Actions

01 Aug 2026

No Dividend history available

No Splits history available

No Bonus history available

No Rights history available
Quality key factors
Valuation key factors
Technicals key factors
 Technical Indicator Scale: Bearish, Mildly Bearish, Sideways, Mildly Bullish, Bullish Turned
 Shareholding Snapshot : Jun 2026
Shareholding Compare (%holding)
Promoters
None
Held by 21 Schemes (2.86%)
Held by 59 FIIs (2.13%)
Adugudi Viswanathan Venkatraman (56.98%)
Gopinath Koteeswaran (4.58%)
25.03%
Quarterly Results Snapshot (Consolidated) - Mar'26 - QoQ

QoQ Growth in quarter ended Mar 2026 is 3.82% vs 7.95% in Dec 2025
QoQ Growth in quarter ended Mar 2026 is 5.21% vs 12.95% in Dec 2025
Half Yearly Results Snapshot (Consolidated) - Sep'25
Growth in half year ended Sep 2025 is 27.26% vs 27.84% in Sep 2024

Growth in half year ended Sep 2025 is 20.83% vs 17.84% in Sep 2024
Nine Monthly Results Snapshot (Consolidated) - Dec'25
YoY Growth in nine months ended Dec 2025 is 25.32% vs 31.26% in Dec 2024
YoY Growth in nine months ended Dec 2025 is 20.43% vs 6.45% in Dec 2024
Annual Results Snapshot (Consolidated) - Mar'26
YoY Growth in year ended Mar 2026 is 25.05% vs 32.33% in Mar 2025
YoY Growth in year ended Mar 2026 is 13.74% vs 9.80% in Mar 2025
About Latent View Analytics Ltd

Company Coordinates


