
Compare Laxmi Cotspin with Similar Stocks
Dashboard
With a Operating Losses, the company has a Weak Long Term Fundamental Strength
- Poor long term growth as Net Sales has grown by an annual rate of 1.69% over the last 5 years
- Low ability to service debt as the company has a high Debt to EBITDA ratio of 42.67 times
Negative results in Mar 26
Risky - Negative Operating Profits
Below par performance in long term as well as near term
Stock DNA
Garments & Apparels
INR 27 Cr (Micro Cap)
NA (Loss Making)
26
0.00%
0.70
-3.29%
0.42
Total Returns (Price + Dividend) 
Latest dividend: 0.5 per share ex-dividend date: Aug-02-2018
Risk Adjusted Returns v/s
Returns Beta

News
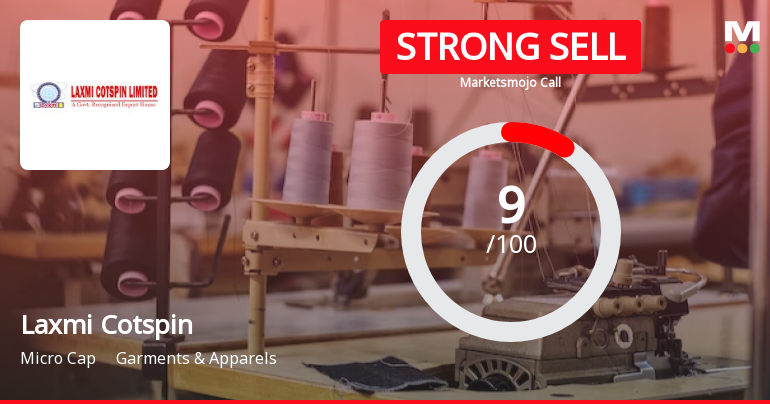
Laxmi Cotspin Ltd is Rated Strong Sell
Laxmi Cotspin Ltd is rated Strong Sell by MarketsMOJO, with this rating last updated on 14 February 2026. However, the analysis and financial metrics discussed here reflect the stock’s current position as of 10 July 2026, providing investors with an up-to-date view of the company’s fundamentals, valuation, financial trends, and technical outlook.
Read full news article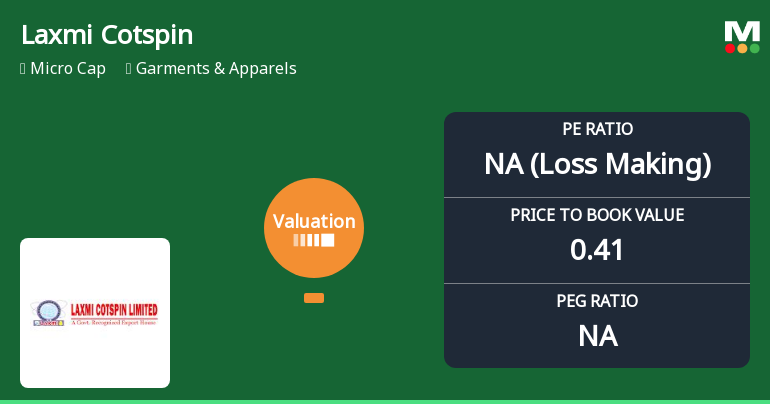
Laxmi Cotspin Ltd Valuation Shifts Signal Elevated Risk Amid Sector Challenges
Laxmi Cotspin Ltd, a micro-cap player in the Garments & Apparels sector, has experienced a marked deterioration in its valuation parameters, shifting from a previously attractive profile to one now classified as risky. This change, coupled with a recent downgrade in its Mojo Grade to Strong Sell, highlights growing concerns about the company’s financial health and market positioning relative to its peers and broader benchmarks.
Read full news articleAre Laxmi Cotspin Ltd latest results good or bad?
Laxmi Cotspin Ltd's latest financial results for Q4 FY26 indicate significant operational challenges and a sharp decline in performance compared to previous periods. The company reported a net loss of ₹1.44 crores, marking a stark contrast to a profit of ₹7.45 crores in the same quarter last year. This reflects a substantial deterioration in profitability, with a year-on-year decline of 119.33%. Revenue for the quarter also contracted sharply to ₹17.28 crores, down 29.67% from the previous quarter and 23.06% year-on-year, representing the lowest revenue level in the past seven quarters. This decline highlights ongoing difficulties in the company's core spinning and textile operations, which have been under pressure from various external factors, including raw material price volatility and subdued domestic demand. The operating performance further illustrates the company's distress, with an operating margi...
Read full news article Announcements
Laxmi Cotspin Limited - Outcome of Board Meeting
14-Nov-2019 | Source : NSELaxmi Cotspin Limited has informed the Exchange regarding Board meeting held on November 13, 2019.
Laxmi Cotspin Limited - Outcome of Board Meeting
09-Oct-2019 | Source : NSELaxmi Cotspin Limited has informed the Exchange regarding Outcome of Board Meeting held on October 07, 2019.
Corporate Actions

No Upcoming Board Meetings

Laxmi Cotspin Ltd has declared 5% dividend, ex-date: 02 Aug 18

No Splits history available

No Bonus history available

No Rights history available
Quality key factors
Valuation key factors
Technicals key factors
 Technical Indicator Scale: Bearish, Mildly Bearish, Sideways, Mildly Bullish, Bullish Turned
 Shareholding Snapshot : Mar 2026
Shareholding Compare (%holding)
Promoters
None
Held by 0 Schemes
Held by 0 FIIs
None
Rajuri Steels & Tmt Bars Private Limited (2.93%)
31.49%
Quarterly Results Snapshot (Consolidated) - Mar'26 - YoY

YoY Growth in quarter ended Mar 2026 is -23.06% vs -38.95% in Mar 2025

YoY Growth in quarter ended Mar 2026 is -119.33% vs 3.47% in Mar 2025
Half Yearly Results Snapshot (Consolidated) - Sep'25
Growth in half year ended Sep 2025 is 25.37% vs 14.00% in Sep 2024
Growth in half year ended Sep 2025 is 123.55% vs -36.47% in Sep 2024
Nine Monthly Results Snapshot (Consolidated) - Dec'25
YoY Growth in nine months ended Dec 2025 is 4.25% vs 19.33% in Dec 2024
YoY Growth in nine months ended Dec 2025 is 103.29% vs 6.43% in Dec 2024
Annual Results Snapshot (Consolidated) - Mar'26
YoY Growth in year ended Mar 2026 is 0.17% vs 4.44% in Mar 2025
YoY Growth in year ended Mar 2026 is -360.87% vs 270.37% in Mar 2025
About Laxmi Cotspin Ltd

Company Coordinates


