
Compare Laxmi Dental with Similar Stocks
Dashboard
The company is Net-Debt Free
Healthy long term growth as Operating profit has grown by an annual rate 149.66%
The company declared positive results in Mar'26 after flat results in Dec'25
With ROE of 14.3, it has a Attractive valuation with a 5.1 Price to Book Value
High Institutional Holdings at 41.73%
Underperformed the market in the last 1 year
Stock DNA
Healthcare Services
INR 1,205 Cr (Small Cap)
36.00
92
0.00%
-0.04
14.29%
4.82
Total Returns (Price + Dividend) 
Laxmi Dental for the last several years.
Risk Adjusted Returns v/s
Returns Beta

News
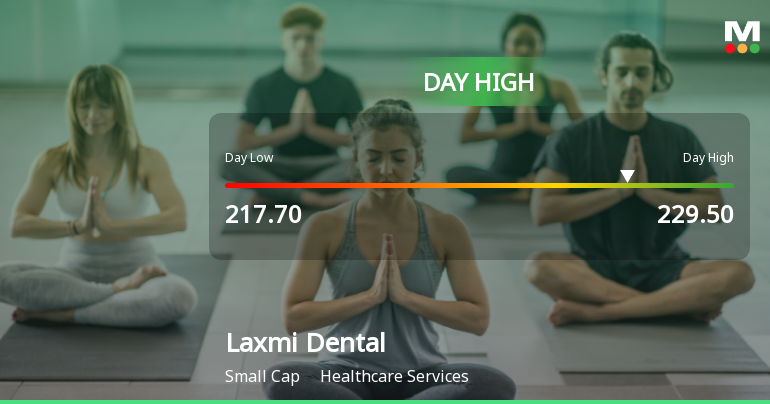
Laxmi Dental Ltd Surges 7.41% to Day's High of Rs 228.5 — Outperforms Sector by 7.34 Percentage Points
The Sensex gained 0.97% on 12 Jun 2026, yet Laxmi Dental Ltd surged 7.41%, outperforming its Healthcare Services sector by 7.34 percentage points. This sharp single-session advance rewrites the short-term narrative for the small-cap stock, raising the question of whether this is a genuine breakout or a tactical bounce within a broader trend.
Read full news article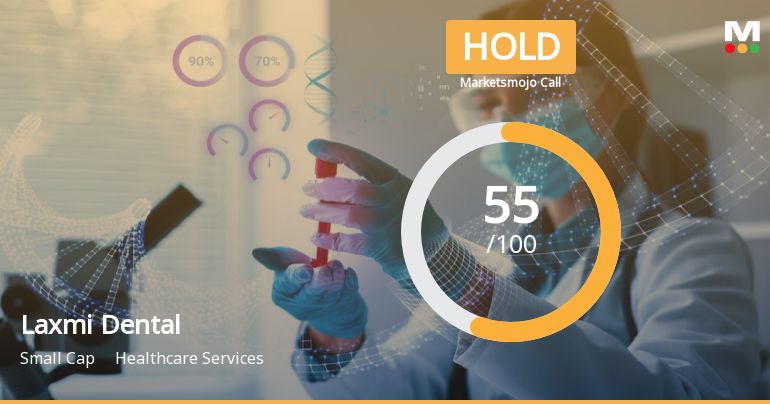
Laxmi Dental Ltd is Rated Hold by MarketsMOJO
Laxmi Dental Ltd is rated 'Hold' by MarketsMOJO, with this rating last updated on 01 June 2026. However, the analysis and financial metrics discussed here reflect the company’s current position as of 10 June 2026, providing investors with the latest insights into its performance and outlook.
Read full news article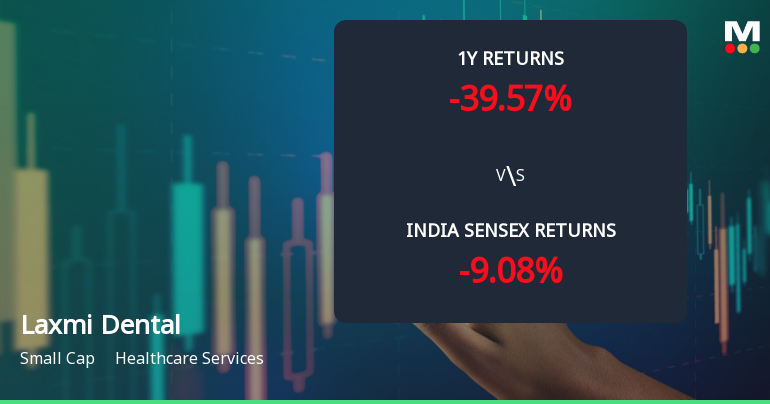
Laxmi Dental Ltd Technical Momentum Shifts Amid Market Volatility
Laxmi Dental Ltd, a small-cap player in the Healthcare Services sector, has experienced a notable shift in its technical momentum, moving from a mildly bullish to a mildly bearish stance. Despite a recent downgrade in its Mojo Grade from Buy to Hold, the stock’s technical indicators present a nuanced picture, reflecting both short-term caution and pockets of underlying strength amid volatile price action.
Read full news article Announcements
Compliances-Reg.24(A)-Annual Secretarial Compliance
30-May-2026 | Source : BSEWe submit herewith the Annual Secretarial Compliance Report for the financial year ended March 31 2026 issued by M/s. M. Jawadwala & Co. Practicing Company Secretaries.
Announcement under Regulation 30 (LODR)-Earnings Call Transcript
30-May-2026 | Source : BSEEarnings Call Transcript
Announcement under Regulation 30 (LODR)-Newspaper Publication
23-May-2026 | Source : BSEExtract of newspaper advertisements published on May 23 2026 in the Financial Express (English Newspaper) and Mumbai Lakshdeep (Marathi Newspaper) with respect to Audited Standalone and Consolidated Financial Results for the quarter and financial year ended March 31 2026 approved by the Board of Directors at its meeting held on Thursday May 21 2026.
Corporate Actions

No Upcoming Board Meetings

No Dividend history available

No Splits history available

No Bonus history available

No Rights history available
Quality key factors
Valuation key factors
Technicals key factors
 Technical Indicator Scale: Bearish, Mildly Bearish, Sideways, Mildly Bullish, Bullish Turned
 Shareholding Snapshot : Mar 2026
Shareholding Compare (%holding)
Promoters
None
Held by 10 Schemes (10.32%)
Held by 18 FIIs (31.21%)
Rajesh Vrajlal Khakhar (16.95%)
Orbimed Asia Ii Mauritius Limited (22.41%)
11.52%
Quarterly Results Snapshot (Consolidated) - Mar'26 - QoQ

QoQ Growth in quarter ended Mar 2026 is 11.98% vs -8.62% in Dec 2025
QoQ Growth in quarter ended Mar 2026 is 409.09% vs -76.79% in Dec 2025
Half Yearly Results Snapshot (Standalone) - Sep'25
Not Applicable: The company has declared_date for only one period
Not Applicable: The company has declared_date for only one period
Nine Monthly Results Snapshot (Standalone) - Dec'25
Not Applicable: The company has declared_date for only one period
Not Applicable: The company has declared_date for only one period
Annual Results Snapshot (Consolidated) - Mar'26

YoY Growth in year ended Mar 2026 is 16.21% vs 23.53% in Mar 2025
YoY Growth in year ended Mar 2026 is -8.78% vs 28.21% in Mar 2025
About Laxmi Dental Ltd

Company Coordinates


