
Compare Laxmi India Fin. with Similar Stocks
Stock DNA
Non Banking Financial Company (NBFC)
INR 540 Cr (Micro Cap)
10.00
21
0.00%
2.87
10.69%
1.11
Total Returns (Price + Dividend) 
Laxmi India Fin. for the last several years.
Risk Adjusted Returns v/s
Returns Beta

News
Laxmi India Finance Ltd is Rated Sell
Laxmi India Finance Ltd is rated Sell by MarketsMOJO, with this rating last updated on 01 June 2026. However, the analysis and financial metrics discussed here reflect the company’s current position as of 01 July 2026, providing investors with the most recent and relevant data to assess the stock’s outlook.
Read full news article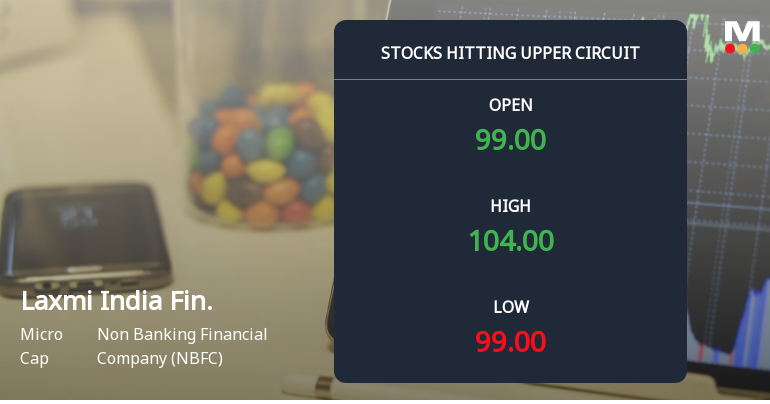
Laxmi India Finance Ltd Locks at Upper Circuit With 4.99% Gain — Buyers Queue, Sellers Absent
At Rs 103.68, the buying was done — not because demand dried up, but because the exchange wouldn't let the stock go any higher. Laxmi India Finance Ltd locked at its upper circuit of 4.99% on 1 Jul 2026, with buyers queuing and no sellers willing to part with shares.
Read full news article
Laxmi India Finance Ltd is Rated Sell
Laxmi India Finance Ltd is rated 'Sell' by MarketsMOJO, with this rating last updated on 01 June 2026. However, the analysis and financial metrics presented here reflect the stock's current position as of 20 June 2026, providing investors with the latest insights into its performance and outlook.
Read full news article Announcements
Closure of Trading Window
26-Jun-2026 | Source : BSEIntimation for Closure of Trading Window
Announcement under Regulation 30 (LODR)-Allotment of ESOP / ESPS
26-May-2026 | Source : BSEWe wish to inform you that the Company by way of Circular Resolution has allotted 125203 equity shares of Rs. 5/- each pursuant to Laxmi India Finance Limited Employee Stock Option Scheme-2023.
Compliances-Reg.24(A)-Annual Secretarial Compliance
25-May-2026 | Source : BSEAnnual Secretarial Compliance Report for the Financial Year ended March 31 2026
Corporate Actions

No Upcoming Board Meetings

No Dividend history available

No Splits history available

No Bonus history available

No Rights history available
Quality key factors
Valuation key factors
Technicals key factors
 Technical Indicator Scale: Bearish, Mildly Bearish, Sideways, Mildly Bullish, Bullish Turned
 Shareholding Snapshot : Mar 2026
Shareholding Compare (%holding)
Promoters
None
Held by 0 Schemes
Held by 9 FIIs (1.58%)
Hirak Vinimay Private Limited (41.61%)
Mukul Mahavir Agrawal (3.83%)
25.64%
Quarterly Results Snapshot (Standalone) - Mar'26 - QoQ

QoQ Growth in quarter ended Mar 2026 is 17.77% vs 4.18% in Dec 2025
QoQ Growth in quarter ended Mar 2026 is 103.98% vs 7.02% in Dec 2025
Half Yearly Results Snapshot (Standalone) - Sep'25

Growth in half year ended Sep 2025 is 31.84% vs 50.82% in Sep 2024
Growth in half year ended Sep 2025 is 25.52% vs 163.45% in Sep 2024
Nine Monthly Results Snapshot (Standalone) - Dec'25
YoY Growth in nine months ended Dec 2025 is 30.76% vs 3.31% in Dec 2024
YoY Growth in nine months ended Dec 2025 is 36.44% vs -18.58% in Dec 2024
Annual Results Snapshot (Standalone) - Mar'26
YoY Growth in year ended Mar 2026 is 29.03% vs 41.91% in Mar 2025
YoY Growth in year ended Mar 2026 is 38.22% vs 60.21% in Mar 2025
About Laxmi India Finance Ltd

Company Coordinates


