
Compare Le Merite Export with Similar Stocks
Dashboard
With a Operating Losses, the company has a Weak Long Term Fundamental Strength
- Poor long term growth as Net Sales has grown by an annual rate of 5.80% and Operating profit at 0.80% over the last 5 years
- NET SALES(Q) At Rs 73.58 cr has Fallen at -25.1% (vs previous 4Q average)
- PAT(Q) At Rs 0.09 cr has Fallen at -96.1% (vs previous 4Q average)
- OPERATING PROFIT TO INTEREST (Q) Lowest at -0.87 times
With ROE of 8.2, it has a Very Expensive valuation with a 1.9 Price to Book Value
Below par performance in long term as well as near term
Stock DNA
Garments & Apparels
INR 258 Cr (Micro Cap)
26.00
26
0.00%
0.04
8.16%
1.95
Total Returns (Price + Dividend) 
Latest dividend: 0.5 per share ex-dividend date: Sep-22-2023
Risk Adjusted Returns v/s
Returns Beta

News
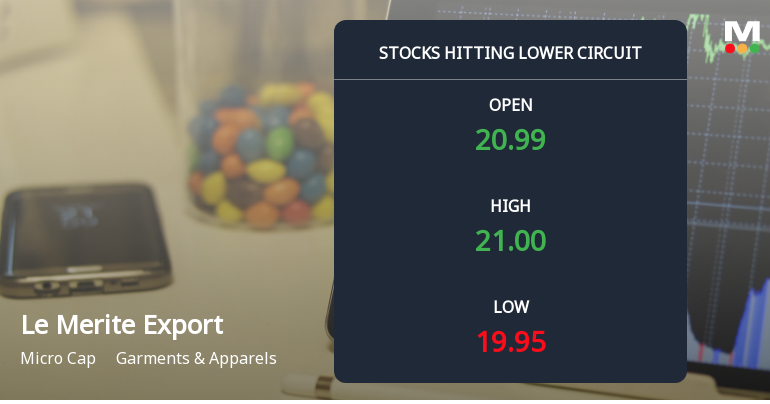
Le Merite Exports Ltd Locks at Lower Circuit With 4.95% Loss — Sellers Queue, No Buyers in Sight
At Rs 19.95, Le Merite Exports Ltd locked at its lower circuit on 16 Jul 2026, reflecting a 4.95% decline within a 5% price band. Sellers were lined up to exit, but the absence of buyers froze the price, creating unfilled supply and a trading halt at the floor price.
Read full news article
Le Merite Exports Ltd Locks at Lower Circuit With 4.99% Loss — Sellers Queue, No Buyers in Sight
At Rs 20.94, sellers were still queuing — but there were no buyers willing to take the other side. Le Merite Exports Ltd locked at its lower circuit of 4.99% on 16 Jul 2026, with unfilled sell orders and a frozen price.
Read full news article
Le Merite Exports Ltd Locks at Lower Circuit With 4.98% Loss — Sellers Queue, No Buyers in Sight
At Rs 21.76, sellers were still queuing — but there were no buyers willing to take the other side. Le Merite Exports Ltd locked at its lower circuit of 4.98% on 15 Jul 2026, with unfilled sell orders and a frozen price.
Read full news article Announcements
Corporate Actions

No Upcoming Board Meetings

Le Merite Exports Ltd has declared 2% dividend, ex-date: 23 Sep 24

Le Merite Exports Ltd has announced 2:10 stock split, ex-date: 29 May 26

No Bonus history available

No Rights history available
Quality key factors
Valuation key factors
Technicals key factors
 Technical Indicator Scale: Bearish, Mildly Bearish, Sideways, Mildly Bullish, Bullish Turned
 Shareholding Snapshot : Mar 2026
Shareholding Compare (%holding)
Promoters
None
Held by 0 Schemes
Held by 6 FIIs (0.22%)
Ashadevi Lath (25.3%)
Meenaxi Dilip Kothari (1.29%)
34.1%
Quarterly Results Snapshot (Standalone) - Mar'26 - QoQ

QoQ Growth in quarter ended Mar 2026 is 0.12% vs -25.17% in Dec 2025

QoQ Growth in quarter ended Mar 2026 is -95.91% vs -50.11% in Dec 2025
Half Yearly Results Snapshot (Consolidated) - Sep'25
Growth in half year ended Sep 2025 is -4.03% vs -25.38% in Mar 2025
Growth in half year ended Sep 2025 is 172.20% vs 5.39% in Mar 2025
Nine Monthly Results Snapshot (Consolidated) - Dec'25
YoY Growth in nine months ended Dec 2025 is -23.13% vs 18.22% in Mar 2026
YoY Growth in nine months ended Dec 2025 is 182.23% vs 58.40% in Mar 2026
Annual Results Snapshot (Consolidated) - Mar'26
YoY Growth in year ended Mar 2026 is -31.04% vs 10.73% in Mar 2025
YoY Growth in year ended Mar 2026 is 112.45% vs 212.00% in Mar 2025
About Le Merite Exports Ltd

Company Coordinates


