
Compare Le Merite Export with Similar Stocks
Dashboard
With a Operating Losses, the company has a Weak Long Term Fundamental Strength
- Poor long term growth as Net Sales has grown by an annual rate of 5.80% and Operating profit at 0.80% over the last 5 years
- NET SALES(Q) At Rs 73.58 cr has Fallen at -25.1% (vs previous 4Q average)
- PAT(Q) At Rs 0.09 cr has Fallen at -96.1% (vs previous 4Q average)
- OPERATING PROFIT TO INTEREST (Q) Lowest at -0.87 times
With ROE of 8.2, it has a Very Expensive valuation with a 2.3 Price to Book Value
Below par performance in long term as well as near term
Stock DNA
Garments & Apparels
INR 301 Cr (Micro Cap)
32.00
23
0.00%
0.04
8.16%
2.34
Total Returns (Price + Dividend) 
Latest dividend: 0.5 per share ex-dividend date: Sep-22-2023
Risk Adjusted Returns v/s
Returns Beta

News

Le Merite Exports Ltd Locks at Lower Circuit With 4.99% Loss — Sellers Queue, No Buyers in Sight
At Rs 24.01, sellers were still queuing — but there were no buyers willing to take the other side. Le Merite Exports Ltd locked at its lower circuit of 4.99% on 11 Jun 2026, with unfilled sell orders and a frozen price.
Read full news article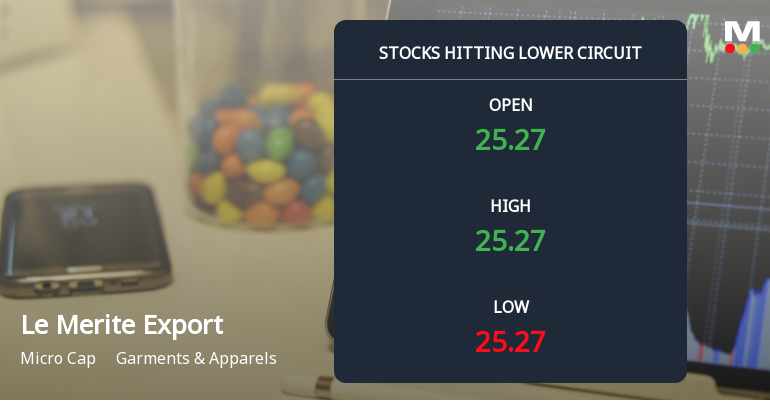
Le Merite Exports Ltd Locks at Lower Circuit With 5.0% Loss — Sellers Queue, No Buyers in Sight
At Rs 25.27, sellers were still queuing — but there were no buyers willing to take the other side. Le Merite Exports Ltd locked at its lower circuit of 5.0% on 10 Jun 2026, with unfilled sell orders and a frozen price.
Read full news article
Le Merite Exports Ltd Locks at Lower Circuit With 4.97% Loss — Sellers Queue, No Buyers in Sight
At Rs 26.6, Le Merite Exports Ltd locked at its lower circuit on 9 Jun 2026, marking a 4.97% decline within a 5% price band. The session ended with unfilled sell orders, as sellers were unable to find buyers willing to transact at these levels, effectively freezing trading at the floor price.
Read full news article Announcements
Corporate Actions

No Upcoming Board Meetings

Le Merite Exports Ltd has declared 2% dividend, ex-date: 23 Sep 24

Le Merite Exports Ltd has announced 2:10 stock split, ex-date: 29 May 26

No Bonus history available

No Rights history available
Quality key factors
Valuation key factors
Technicals key factors
 Technical Indicator Scale: Bearish, Mildly Bearish, Sideways, Mildly Bullish, Bullish Turned
 Shareholding Snapshot : Mar 2026
Shareholding Compare (%holding)
Promoters
None
Held by 0 Schemes
Held by 6 FIIs (0.22%)
Ashadevi Lath (25.3%)
Meenaxi Dilip Kothari (1.29%)
34.1%
Quarterly Results Snapshot (Standalone) - Mar'26 - QoQ

QoQ Growth in quarter ended Mar 2026 is 0.12% vs -25.17% in Dec 2025

QoQ Growth in quarter ended Mar 2026 is -95.91% vs -50.11% in Dec 2025
Half Yearly Results Snapshot (Consolidated) - Sep'25
Growth in half year ended Sep 2025 is -4.03% vs -25.38% in Mar 2025
Growth in half year ended Sep 2025 is 172.20% vs 5.39% in Mar 2025
Nine Monthly Results Snapshot (Consolidated) - Dec'25
YoY Growth in nine months ended Dec 2025 is -23.13% vs 18.22% in Mar 2026
YoY Growth in nine months ended Dec 2025 is 182.23% vs 58.40% in Mar 2026
Annual Results Snapshot (Consolidated) - Mar'26
YoY Growth in year ended Mar 2026 is -31.04% vs 10.73% in Mar 2025
YoY Growth in year ended Mar 2026 is 112.45% vs 212.00% in Mar 2025
About Le Merite Exports Ltd

Company Coordinates


