
Compare Lee & Nee Soft. with Similar Stocks
Dashboard
With a Operating Losses, the company has a Weak Long Term Fundamental Strength
- Poor long term growth as Operating profit has grown by an annual rate 1.74% of over the last 5 years
- Company's ability to service its debt is weak with a poor EBIT to Interest (avg) ratio of -0.92
Flat results in Mar 26
Risky - Negative EBITDA
Below par performance in long term as well as near term
Stock DNA
Computers - Software & Consulting
INR 44 Cr (Micro Cap)
140.00
20
0.00%
-0.04
0.54%
0.76
Total Returns (Price + Dividend) 
Lee & Nee Soft. for the last several years.
Risk Adjusted Returns v/s
Returns Beta

News

Lee & Nee Software (Exports) Ltd is Rated Strong Sell
Lee & Nee Software (Exports) Ltd is rated Strong Sell by MarketsMOJO. This rating was last updated on 18 Nov 2025. However, the analysis and financial metrics presented here reflect the company’s current position as of 18 June 2026, providing investors with the latest insights into the stock’s fundamentals, valuation, financial trend, and technical outlook.
Read full news articleAre Lee & Nee Software (Exports) Ltd latest results good or bad?
Lee & Nee Software (Exports) Ltd's latest financial results for Q4 FY26 reveal a complex operational landscape. The company reported a significant revenue growth of 34.53% quarter-on-quarter, reaching ₹3.74 crores, which marks the strongest quarterly performance in recent history. This growth also reflects a year-on-year increase of 30.77%. However, despite this revenue acceleration, the company continues to face challenges in achieving operational profitability, as indicated by an operating margin of -1.34%, although this represents an improvement from -2.52% in the previous quarter. The net profit for the quarter was ₹0.09 crores, which reflects a decline of 18.18% compared to the previous quarter, despite a substantial year-on-year increase of 200%. This highlights the company's reliance on other income to achieve net profitability, raising concerns about the sustainability of its earnings. The operatin...
Read full news article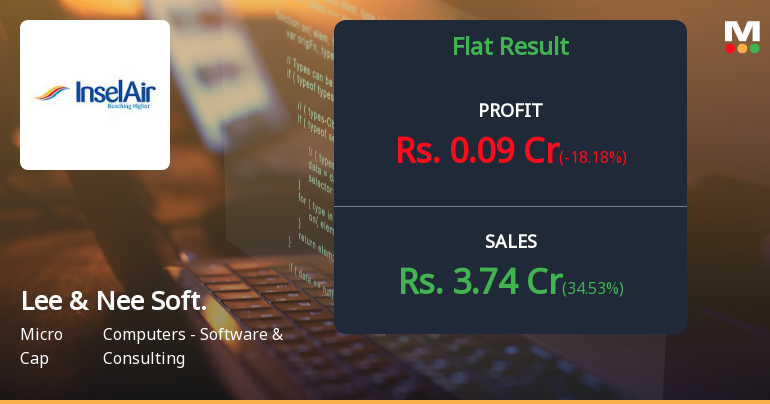
Lee & Nee Software Q4 FY26: Revenue Surge Masks Profitability Concerns as Losses Narrow
Lee & Nee Software (Exports) Ltd., a Kolkata-based IT-enabled services company, reported a net profit of ₹0.09 crores in Q4 FY26, marking a 200.00% year-on-year increase but an 18.18% sequential decline from Q3 FY26's ₹0.11 crores. The micro-cap firm, with a market capitalisation of ₹42.00 crores, continues to grapple with operating losses despite achieving its strongest quarterly revenue performance in recent history at ₹3.74 crores, up 34.53% quarter-on-quarter and 30.77% year-on-year.
Read full news article Announcements
Announcement under Regulation 30 (LODR)-Newspaper Publication
17-Jun-2026 | Source : BSEIntimation of Board Meeting to be held on 25.06.2026 is published in English in Financial Express and in Bengali in Duranta Barta.
Board Meeting Intimation for Board Meeting Intimation For Appointment Of Secretarial Auditor
16-Jun-2026 | Source : BSELee & Nee Softwares Exports Ltdhas informed BSE that the meeting of the Board of Directors of the Company is scheduled on 25/06/2026 inter alia to consider and approve Board meeting for Appointment of Secretarial Auditor is scheduled to be held on Thursday June 25th 2026 inter alia 1. Appointment of Rasna Goyal & Co. Practising Company Secretaries as the Secretarial Auditor of the Company subject to such approvals as may be required 2. Approval of the Notice of Postal Ballot through remote e-voting if required for obtaining the approval of the shareholders in connection with the aforesaid matter 3.. Appointment of a Scrutinizer for conducting the Postal Ballot process through remote e-voting.
Compliances-Reg.24(A)-Annual Secretarial Compliance
29-May-2026 | Source : BSECompliance - Reg 24(A) - Annual Secretarial Compliance
Corporate Actions

25 Jun 2026

No Dividend history available

No Splits history available

No Bonus history available

No Rights history available
Quality key factors
Valuation key factors
Technicals key factors
 Technical Indicator Scale: Bearish, Mildly Bearish, Sideways, Mildly Bullish, Bullish Turned
 Shareholding Snapshot : Mar 2026
Shareholding Compare (%holding)
Promoters
None
Held by 0 Schemes
Held by 0 FIIs
Haresh Collections Pvt. Ltd (18.41%)
Jagadish Prasad Tosawar (1.08%)
28.18%
Quarterly Results Snapshot (Consolidated) - Mar'26 - QoQ

QoQ Growth in quarter ended Mar 2026 is 34.53% vs 10.32% in Dec 2025

QoQ Growth in quarter ended Mar 2026 is -18.18% vs 266.67% in Dec 2025
Half Yearly Results Snapshot (Consolidated) - Sep'25
Growth in half year ended Sep 2025 is 8.76% vs 16.13% in Sep 2024
Growth in half year ended Sep 2025 is 20.00% vs -81.13% in Sep 2024
Nine Monthly Results Snapshot (Consolidated) - Dec'25
YoY Growth in nine months ended Dec 2025 is -0.13% vs 28.13% in Dec 2024
YoY Growth in nine months ended Dec 2025 is -20.69% vs -56.72% in Dec 2024
Annual Results Snapshot (Consolidated) - Mar'26
YoY Growth in year ended Mar 2026 is 8.20% vs 25.79% in Mar 2025
YoY Growth in year ended Mar 2026 is 0.00% vs -38.00% in Mar 2025
About Lee & Nee Software (Exports) Ltd

Company Coordinates


