
Compare Leela Palaces Ho with Similar Stocks
Dashboard
Weak Long Term Fundamental Strength with an average Return on Equity (ROE) of 3.86%
- Poor long term growth as Net Sales has grown by an annual rate of 14.20% over the last 5 years
- Low ability to service debt as the company has a high Debt to EBITDA ratio of 2.44 times
With ROCE of 7.9, it has a Very Expensive valuation with a 2.1 Enterprise value to Capital Employed
100% of Promoter Shares are Pledged
Stock DNA
Hotels & Resorts
INR 15,589 Cr (Small Cap)
38.00
36
0.00%
0.24
6.38%
2.40
Total Returns (Price + Dividend) 
Leela Palaces Ho for the last several years.
Risk Adjusted Returns v/s
Returns Beta

News

Leela Palaces Hotels & Resorts Ltd Shows Technical Momentum Shift Amid Market Rally
Leela Palaces Hotels & Resorts Ltd has demonstrated a notable shift in technical momentum, moving from a mildly bearish stance to a mildly bullish outlook. This change is underscored by key technical indicators such as the MACD, Bollinger Bands, and Dow Theory signals, suggesting a potential recovery phase for the small-cap hotel and resorts player amid broader market fluctuations.
Read full news article
Leela Palaces Hotels & Resorts Ltd Locks at Upper Circuit With 9.99% Gain — Buyers Queue, Sellers Absent
At Rs 472.75, the buying was done — not because demand dried up, but because the exchange wouldn't let the stock go any higher. Leela Palaces Hotels & Resorts Ltd locked at its upper circuit of 9.99% on 15 Jun 2026, with buyers queuing and no sellers willing to part with shares.
Read full news article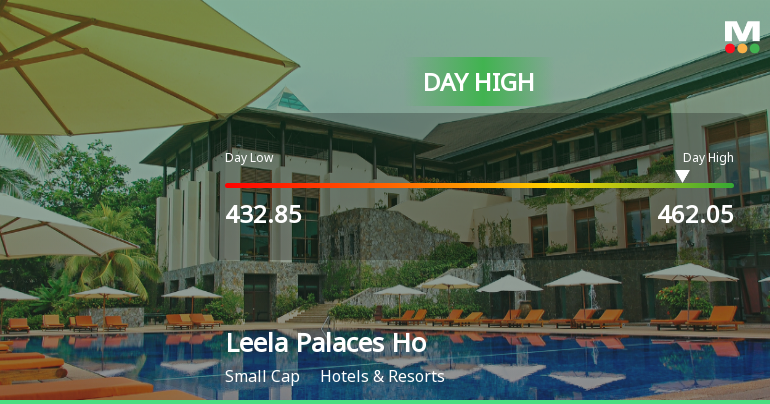
Leela Palaces Hotels & Resorts Ltd Surges 7.49% to Day's High of Rs 462 — Outperforms Sector by 3.86 Percentage Points
The Sensex advanced 1.49% on 15 Jun 2026, yet Leela Palaces Hotels & Resorts Ltd outpaced the broader market with a 7.49% gain, touching an intraday high of Rs 462. This 3.86 percentage-point outperformance over the Hotels, Resort & Restaurants sector’s 2.33% rise signals a distinctly stock-specific momentum shift.
Read full news article Announcements
Compliances-Reg.24(A)-Annual Secretarial Compliance
30-May-2026 | Source : BSEPlease find enclosed the Annual Secretarial Compliance Report for the year ended March 31 2026
Announcement under Regulation 30 (LODR)-Analyst / Investor Meet - Intimation
29-May-2026 | Source : BSEIntimation of schedule of Investors Meet
Intimation Under Regulation 30 Of SEBI (Listing Obligations And Disclosure Requirements) Regulations 2015
13-May-2026 | Source : BSEIntimation under Regulation 30 of SEBI (Listing Obligations and Disclosure Requirements) Regulations 2015
Corporate Actions

No Upcoming Board Meetings

No Dividend history available

No Splits history available

No Bonus history available

No Rights history available
Quality key factors
Valuation key factors
Technicals key factors
 Technical Indicator Scale: Bearish, Mildly Bearish, Sideways, Mildly Bullish, Bullish Turned
 Shareholding Snapshot : Mar 2026
Shareholding Compare (%holding)
Promoters
100
Held by 23 Schemes (6.65%)
Held by 69 FIIs (8.62%)
Project Ballet Bangalore Holdings (difc) Pvt Ltd (45.81%)
Axis Max Life Insurance Limited A/c - Ulif00225/06 (1.93%)
1.99%
Quarterly Results Snapshot (Standalone) - Mar'26 - QoQ

QoQ Growth in quarter ended Mar 2026 is -4.02% vs 21.73% in Dec 2025

QoQ Growth in quarter ended Mar 2026 is 18.80% vs 5.44% in Dec 2025
Half Yearly Results Snapshot (Standalone) - Sep'25
Not Applicable: The company has declared_date for only one period
Not Applicable: The company has declared_date for only one period
Nine Monthly Results Snapshot (Standalone) - Dec'25
Not Applicable: The company has declared_date for only one period
Not Applicable: The company has declared_date for only one period
Annual Results Snapshot (Consolidated) - Mar'26
YoY Growth in year ended Mar 2026 is 17.43% vs 11.02% in Mar 2025
YoY Growth in year ended Mar 2026 is 742.84% vs 2,345.54% in Mar 2025
About Leela Palaces Hotels & Resorts Ltd

Company Coordinates


