
Compare Lehar Footwears with Similar Stocks
Dashboard
Healthy long term growth as Operating profit has grown by an annual rate 48.61%
Flat results in Mar 26
With ROCE of 19.9, it has a Attractive valuation with a 2.8 Enterprise value to Capital Employed
Majority shareholders : Promoters
Market Beating performance in long term as well as near term
Total Returns (Price + Dividend) 
Latest dividend: 0.5 per share ex-dividend date: Sep-08-2025
Risk Adjusted Returns v/s
Returns Beta

News
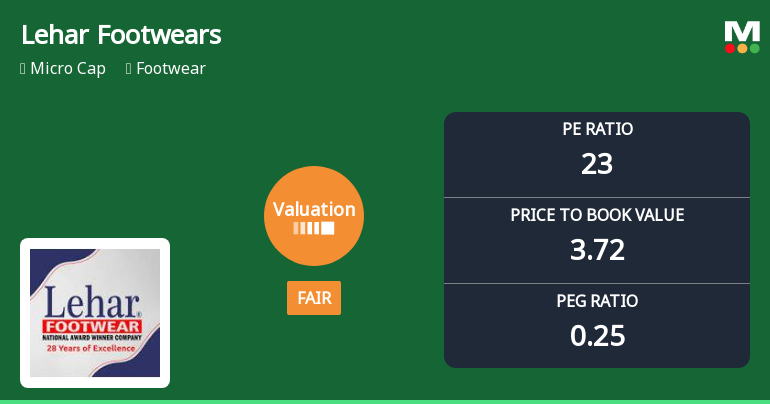
Lehar Footwears Ltd Valuation Shifts to Fair Amid Strong Market Performance
Lehar Footwears Ltd has witnessed a notable shift in its valuation parameters, moving from an attractive to a fair rating as of June 2026. This change reflects evolving market perceptions amid robust stock performance and shifting sector dynamics, prompting investors to reassess the company’s price attractiveness relative to historical and peer benchmarks.
Read full news article
Lehar Footwears Ltd Upgraded to Hold on Technical and Valuation Improvements
Lehar Footwears Ltd has seen its investment rating upgraded from Sell to Hold, driven primarily by a marked improvement in technical indicators and a more attractive valuation profile. Despite flat quarterly financials, the company’s long-term growth prospects and market-beating returns have supported this positive reassessment.
Read full news article
Golden Cross Forms in Lehar Footwears Ltd — Mixed Technical Signals Cloud the Outlook
The 50-day moving average has crossed above the 200-day moving average for Lehar Footwears Ltd, signalling a golden cross on 19 Jun 2026. Yet, the broader technical picture is conflicted, with monthly momentum indicators showing mild bearishness despite weekly signals trending positive. This divergence raises questions about the reliability of the crossover as a standalone bullish signal.
Read full news article Announcements
Announcement under Regulation 30 (LODR)-Award_of_Order_Receipt_of_Order
22-Jun-2026 | Source : BSELehar Footwears bags OEM Order worth Rs. 39.70 Crores
Disclosures under Reg. 29(2) of SEBI (SAST) Regulations 2011
08-Jun-2026 | Source : BSEThe Exchange has received the disclosure under Regulation 29(2) of SEBI (Substantial Acquisition of Shares & Takeovers) Regulations 2011 for Latadevi Gadia
Disclosures under Reg. 29(2) of SEBI (SAST) Regulations 2011
08-Jun-2026 | Source : BSEThe Exchange has received the disclosure under Regulation 29(2) of SEBI (Substantial Acquisition of Shares & Takeovers) Regulations 2011 for Latadevi Gadia
Corporate Actions

No Upcoming Board Meetings

Lehar Footwears Ltd has declared 5% dividend, ex-date: 08 Sep 25

No Splits history available

No Bonus history available

No Rights history available
Quality key factors
Valuation key factors
Technicals key factors
 Technical Indicator Scale: Bearish, Mildly Bearish, Sideways, Mildly Bullish, Bullish Turned
 Shareholding Snapshot : Mar 2026
Shareholding Compare (%holding)
Promoters
None
Held by 0 Schemes
Held by 1 FIIs (0.26%)
Ramesh Chand Agarwal (11.42%)
Abhijit Periwal (2.18%)
23.0%
Quarterly Results Snapshot (Standalone) - Mar'26 - QoQ

QoQ Growth in quarter ended Mar 2026 is 59.74% vs -59.34% in Dec 2025
QoQ Growth in quarter ended Mar 2026 is 94.37% vs -70.78% in Dec 2025
Half Yearly Results Snapshot (Standalone) - Sep'25
Growth in half year ended Sep 2025 is 180.36% vs -16.19% in Sep 2024
Growth in half year ended Sep 2025 is 298.90% vs -15.31% in Sep 2024
Nine Monthly Results Snapshot (Standalone) - Dec'25
YoY Growth in nine months ended Dec 2025 is 102.58% vs 7.49% in Dec 2024
YoY Growth in nine months ended Dec 2025 is 186.28% vs 9.18% in Dec 2024
Annual Results Snapshot (Standalone) - Mar'26
YoY Growth in year ended Mar 2026 is 55.52% vs 42.70% in Mar 2025
YoY Growth in year ended Mar 2026 is 91.72% vs 65.70% in Mar 2025
About Lehar Footwears Ltd

Company Coordinates


