
Compare Lemon Tree Hotel with Similar Stocks
Dashboard
Low ability to service debt as the company has a high Debt to EBITDA ratio of 2.90 times
- Low ability to service debt as the company has a high Debt to EBITDA ratio of 2.90 times
With ROCE of 17.1, it has a Expensive valuation with a 3.3 Enterprise value to Capital Employed
Underperformed the market in the last 1 year
Stock DNA
Hotels & Resorts
INR 8,826 Cr (Small Cap)
34.00
35
0.00%
1.32
18.29%
6.11
Total Returns (Price + Dividend) 
Lemon Tree Hotel for the last several years.
Risk Adjusted Returns v/s
Returns Beta

News
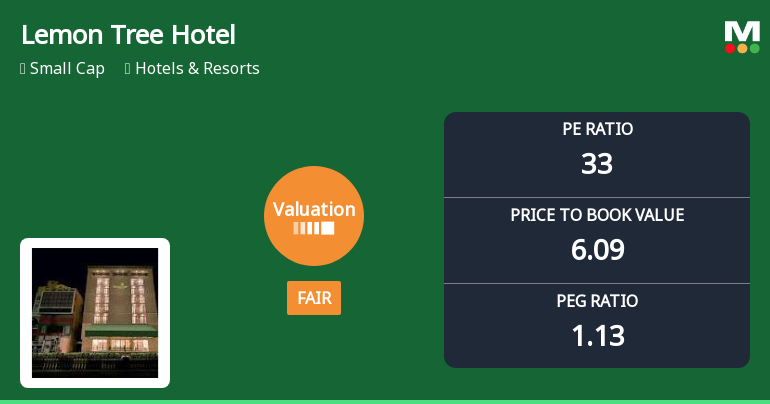
Lemon Tree Hotels Ltd Valuation Shifts to Fair Amid Market Pressure
Lemon Tree Hotels Ltd has witnessed a notable shift in its valuation parameters, moving from an expensive to a fair valuation grade as of January 2026. This transition reflects evolving market perceptions amid a challenging sector backdrop, with the company’s price-to-earnings (P/E) and price-to-book value (P/BV) ratios adjusting relative to historical averages and peer benchmarks. Investors are now reassessing the stock’s price attractiveness in light of these changes and the company’s recent performance metrics.
Read full news article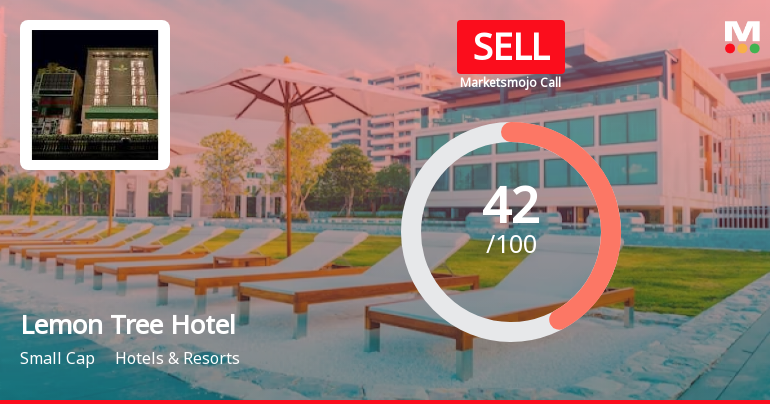
Lemon Tree Hotels Ltd is Rated Sell
Lemon Tree Hotels Ltd is rated Sell by MarketsMOJO, with this rating last updated on 19 Jan 2026. However, the analysis and financial metrics discussed here reflect the company’s current position as of 08 June 2026, providing investors with an up-to-date view of the stock’s fundamentals, valuation, financial trends, and technical outlook.
Read full news articleAre Lemon Tree Hotels Ltd latest results good or bad?
Lemon Tree Hotels Ltd reported its financial results for the quarter ended March 2026, showcasing a consolidated net profit of ₹91.49 crores, which reflects an 8.09% year-on-year growth. This is a notable deceleration compared to the previous year's growth rate of 26.37%. The company's revenue for the same quarter reached ₹416.40 crores, marking a 10.01% increase year-on-year, down from 15.65% in the prior year. The operating margin, excluding other income, stood at 51.69%, which indicates a slight contraction from the previous year's margin of 53.92%. This suggests that while the company has maintained a strong margin above 50%, there are challenges in sustaining the same level of operational efficiency compared to the prior year. The financial performance in Q4 FY26 highlights a strong finish to the fiscal year, with the highest quarterly revenue recorded. However, the market's response has been cautiou...
Read full news article Announcements
Announcement under Regulation 30 (LODR)-Analyst / Investor Meet - Intimation
10-Jun-2026 | Source : BSEPlease find enclosed the schedule for Analysts / Institutional Investor meeting.
Announcement under Regulation 30 (LODR)-Press Release / Media Release
08-Jun-2026 | Source : BSEPress Release - Company has signed a franchise agreement viz. Keys Prima by Lemon Tree Hotels Jaipur Rajasthan
Announcement under Regulation 30 (LODR)-Change in Management
08-Jun-2026 | Source : BSEAppointment of Senior Management Personnel of the Company
Corporate Actions

No Upcoming Board Meetings

No Dividend history available

No Splits history available

No Bonus history available

No Rights history available
Quality key factors
Valuation key factors
Technicals key factors
 Technical Indicator Scale: Bearish, Mildly Bearish, Sideways, Mildly Bullish, Bullish Turned
 Shareholding Snapshot : Mar 2026
Shareholding Compare (%holding)
Non Institution
None
Held by 23 Schemes (14.91%)
Held by 171 FIIs (21.6%)
Spank Management Services Private Limited (21.12%)
Apg Strategic Real Estate Pool N.v. (14.99%)
20.48%
Quarterly Results Snapshot (Consolidated) - Mar'26 - YoY

YoY Growth in quarter ended Mar 2026 is 10.01% vs 15.65% in Mar 2025
YoY Growth in quarter ended Mar 2026 is 8.09% vs 26.37% in Mar 2025
Half Yearly Results Snapshot (Consolidated) - Sep'25
Growth in half year ended Sep 2025 is 12.61% vs 22.90% in Sep 2024

Growth in half year ended Sep 2025 is 47.48% vs 7.24% in Sep 2024
Nine Monthly Results Snapshot (Consolidated) - Dec'25
YoY Growth in nine months ended Dec 2025 is 13.28% vs 22.71% in Dec 2024
YoY Growth in nine months ended Dec 2025 is 21.14% vs 37.33% in Dec 2024
Annual Results Snapshot (Consolidated) - Mar'26
YoY Growth in year ended Mar 2026 is 12.32% vs 20.07% in Mar 2025
YoY Growth in year ended Mar 2026 is 15.53% vs 32.39% in Mar 2025
About Lemon Tree Hotels Ltd

Company Coordinates


