
Compare Lenskart Solut. with Similar Stocks
Dashboard
Healthy long term growth as Net Sales has grown by an annual rate of 0% and Operating profit at 0%
With a growth in Net Profit of 50.38%, the company declared Very Positive results in Mar 26
With ROCE of 7.1, it has a Very Expensive valuation with a 9.6 Enterprise value to Capital Employed
Majority shareholders : Non Institution
With its market cap of Rs 94,786 cr, it is the biggest company in the sector and constitutes 74.04% of the entire sector
Stock DNA
Diversified consumer products
INR 96,212 Cr (Mid Cap)
187.00
98
0.00%
0.14
5.78%
10.85
Total Returns (Price + Dividend) 
Lenskart Solut. for the last several years.
Risk Adjusted Returns v/s
Returns Beta

News
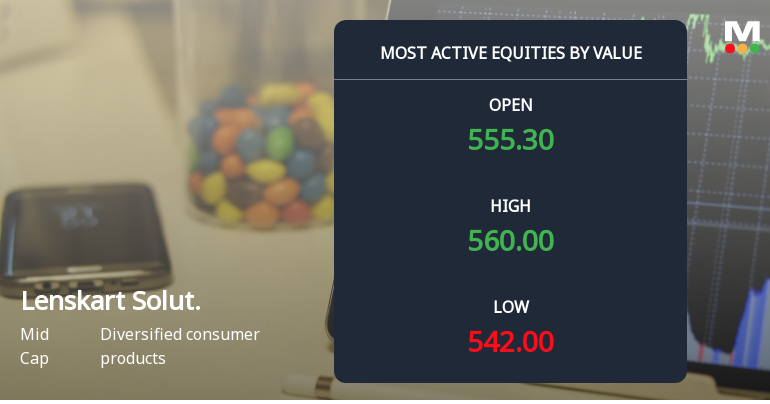
Lenskart Solutions Ltd Sees High-Value Trading Amid Mixed Market Signals
Lenskart Solutions Ltd, a mid-cap player in the diversified consumer products sector, witnessed one of the highest value turnovers on 10 July 2026, with over ₹559 crore traded on the day. Despite this robust trading activity, the stock marginally declined by 0.03%, underperforming its sector and broader market indices. Institutional interest and rising investor participation continue to shape the stock’s near-term outlook amid a complex market backdrop.
Read full news article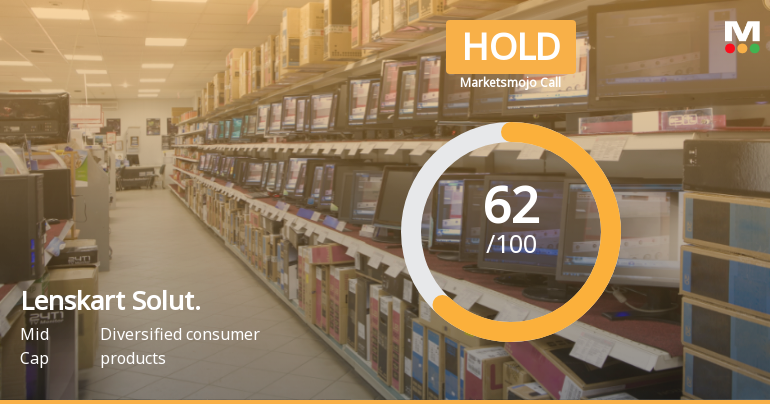
Lenskart Solutions Ltd Upgraded to Hold by MarketsMOJO on Improved Technicals and Financials
Lenskart Solutions Ltd has seen its investment rating upgraded from Sell to Hold as of 9 July 2026, reflecting a marked improvement in its technical indicators and robust financial performance. The mid-cap stock, operating in the diversified consumer products sector, has demonstrated positive momentum across quality, valuation, financial trends, and technical parameters, prompting a reassessment of its outlook by analysts.
Read full news article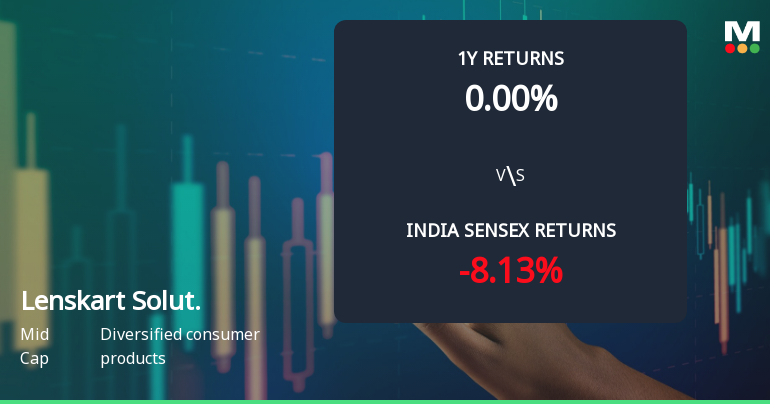
Lenskart Solutions Ltd Sees Technical Momentum Shift Amid Strong Price Gains
Lenskart Solutions Ltd has exhibited a notable shift in its technical momentum, moving from a mildly bearish stance to a mildly bullish outlook. This change is underscored by improvements in key indicators such as the MACD, Bollinger Bands, and Dow Theory signals, alongside a recent upgrade in its Mojo Grade from Sell to Hold. Investors should consider these developments in the context of the stock’s strong recent price performance and relative outperformance against the Sensex.
Read full news article Announcements
Corporate Actions

No Upcoming Board Meetings

No Dividend history available

No Splits history available

No Bonus history available

No Rights history available
Quality key factors
Valuation key factors
Technicals key factors
 Technical Indicator Scale: Bearish, Mildly Bearish, Sideways, Mildly Bullish, Bullish Turned
 Shareholding Snapshot : Mar 2026
Shareholding Compare (%holding)
Non Institution
None
Held by 29 Schemes (6.43%)
Held by 151 FIIs (4.26%)
Peyush Bansal (8.8%)
Svf Ii Lightbulb (cayman) Limited (13.13%)
1.33%
Quarterly Results Snapshot (Standalone) - Mar'26 - QoQ

QoQ Growth in quarter ended Mar 2026 is 6.50% vs 12.34% in Dec 2025

QoQ Growth in quarter ended Mar 2026 is 50.38% vs 9.75% in Dec 2025
Half Yearly Results Snapshot (Standalone) - Sep'25
Not Applicable: The company has declared_date for only one period
Not Applicable: The company has declared_date for only one period
Nine Monthly Results Snapshot (Standalone) - Dec'25
Not Applicable: The company has declared_date for only one period
Not Applicable: The company has declared_date for only one period
Annual Results Snapshot (Consolidated) - Mar'26
YoY Growth in year ended Mar 2026 is 32.49% vs 22.57% in Mar 2025
YoY Growth in year ended Mar 2026 is 66.99% vs 1,792.96% in Mar 2025
About Lenskart Solutions Ltd

Company Coordinates


