
Compare Lenskart Solut. with Similar Stocks
Stock DNA
Diversified consumer products
INR 94,612 Cr (Mid Cap)
186.00
97
0.00%
0.14
5.78%
10.72
Total Returns (Price + Dividend) 
Lenskart Solut. for the last several years.
Risk Adjusted Returns v/s
Returns Beta

News
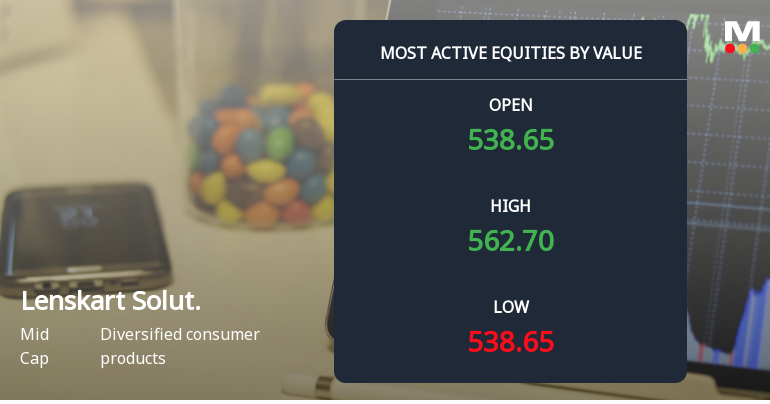
Lenskart Solutions Ltd Sees Robust Value Trading Amid Mixed Sector Performance
Lenskart Solutions Ltd, a mid-cap player in the diversified consumer products sector, witnessed significant trading activity on 9 July 2026, with its stock hitting a new 52-week and all-time high of ₹563. Despite this milestone, the company’s recent downgrade from Hold to Sell by MarketsMOJO reflects a cautious outlook amid mixed market performance and fluctuating investor participation.
Read full news article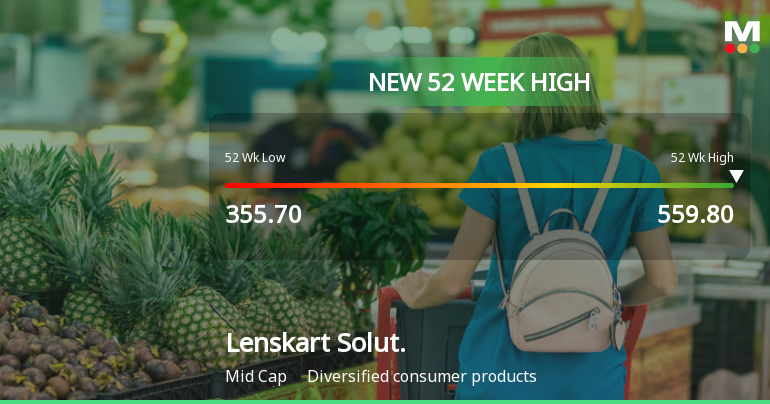
Broad-Based Technical Strength Lifts Lenskart Solutions Ltd to 52-Week High of Rs 562.2
With every major moving average crossed and a fresh 52-week high of Rs 562.2 reached on 9 Jul 2026, Lenskart Solutions Ltd has demonstrated robust price momentum that outpaces its sector and the broader market.
Read full news article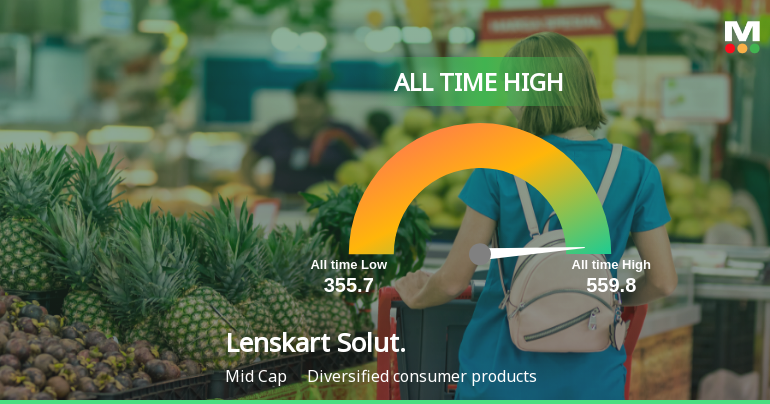
Lenskart Solutions Ltd Hits All-Time High of Rs 559.4 as Momentum Builds Across Timeframes
Extending its recent gains, Lenskart Solutions Ltd touched an intraday high of Rs 559.4 on 09 Jul 2026, marking a fresh all-time peak just shy of its 52-week high of Rs 559.8. This milestone caps a strong run that has seen the stock outperform both its sector and the broader Sensex over multiple timeframes.
Read full news article Announcements
Announcement under Regulation 30 (LODR)-Restructuring
02-Jul-2026 | Source : BSELenskart Solutions Limited has informed the Exchange about the incorporation of a Joint Venture Company in India with Mingfeng Glassesworld Limited pursuant to a strategic partnership between the parties
Announcement under Regulation 30 (LODR)-Restructuring
02-Jul-2026 | Source : BSELenskart Solutions Limited has informed the Exchange about approval of Scheme of Amalgamation of Dealskart Online Services Private Limited and Lenskart Eyetech Private Limited wholly-owned subsidiaries of the Company with and into Lenskart Solution Limited and their respective shareholders and creditors
Board Meeting Outcome for Outcome Of Board Meeting Held On July 02 2026
02-Jul-2026 | Source : BSELenskart Solutions Limited has informed the Exchange regarding Outcome of Board Meeting held on July 02 2026
Corporate Actions

No Upcoming Board Meetings

No Dividend history available

No Splits history available

No Bonus history available

No Rights history available
Quality key factors
Valuation key factors
Technicals key factors
 Technical Indicator Scale: Bearish, Mildly Bearish, Sideways, Mildly Bullish, Bullish Turned
 Shareholding Snapshot : Mar 2026
Shareholding Compare (%holding)
Non Institution
None
Held by 29 Schemes (6.43%)
Held by 151 FIIs (4.26%)
Peyush Bansal (8.8%)
Svf Ii Lightbulb (cayman) Limited (13.13%)
1.33%
Quarterly Results Snapshot (Standalone) - Mar'26 - QoQ

QoQ Growth in quarter ended Mar 2026 is 6.50% vs 12.34% in Dec 2025

QoQ Growth in quarter ended Mar 2026 is 50.38% vs 9.75% in Dec 2025
Half Yearly Results Snapshot (Standalone) - Sep'25
Not Applicable: The company has declared_date for only one period
Not Applicable: The company has declared_date for only one period
Nine Monthly Results Snapshot (Standalone) - Dec'25
Not Applicable: The company has declared_date for only one period
Not Applicable: The company has declared_date for only one period
Annual Results Snapshot (Consolidated) - Mar'26
YoY Growth in year ended Mar 2026 is 32.49% vs 22.57% in Mar 2025
YoY Growth in year ended Mar 2026 is 66.99% vs 1,792.96% in Mar 2025
About Lenskart Solutions Ltd

Company Coordinates


