
Compare Lenskart Solut. with Similar Stocks
Dashboard
Healthy long term growth as Net Sales has grown by an annual rate of 0% and Operating profit at 0%
With a growth in Net Profit of 50.38%, the company declared Very Positive results in Mar 26
With ROCE of 7.1, it has a Very Expensive valuation with a 9 Enterprise value to Capital Employed
Majority shareholders : Non Institution
With its market cap of Rs 89,814 cr, it is the biggest company in the sector and constitutes 73.37% of the entire sector
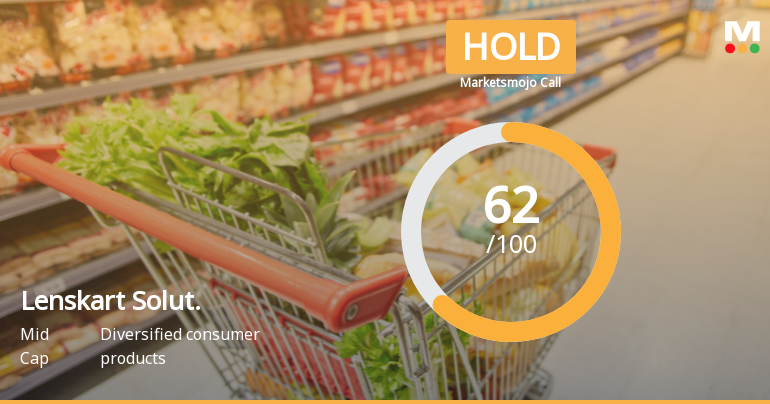
Stock DNA
Diversified consumer products
INR 90,274 Cr (Mid Cap)
175.00
94
0.00%
0.14
5.78%
10.28
Total Returns (Price + Dividend) 
Lenskart Solut. for the last several years.
Risk Adjusted Returns v/s
Returns Beta

News
Lenskart Solutions Ltd Upgraded to Hold by MarketsMOJO on Improved Technicals and Financials
Lenskart Solutions Ltd has seen its investment rating upgraded from Sell to Hold, reflecting a marked improvement in technical indicators alongside robust financial performance. The mid-cap diversified consumer products company’s recent quarterly results and evolving market trends have contributed to a more favourable outlook, signalling cautious optimism among investors.
Read full news article
Lenskart Solutions Ltd Technical Momentum Shifts Amid Mixed Market Signals
Lenskart Solutions Ltd has experienced a subtle but notable shift in its technical momentum, transitioning from a sideways trend to a mildly bullish stance. Despite a slight dip in daily price, the stock’s technical indicators reveal a complex interplay of signals that investors should carefully analyse amid a challenging market backdrop.
Read full news article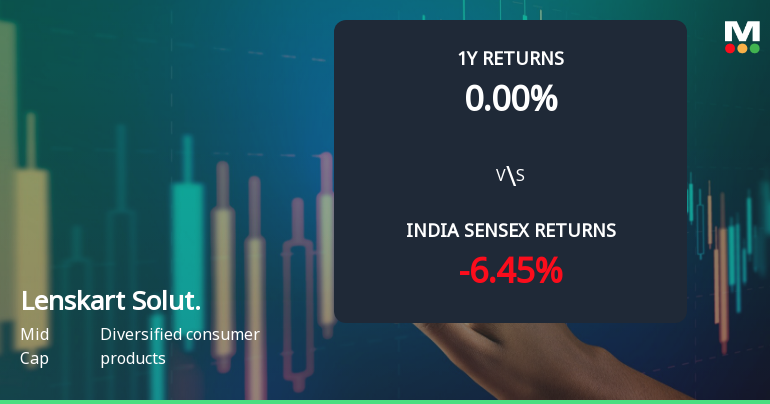
Lenskart Solutions Ltd Technical Momentum Shifts Amid Sideways Trend
Lenskart Solutions Ltd has experienced a notable shift in its technical momentum, moving from a mildly bearish stance to a sideways trend, reflecting a period of consolidation after recent price advances. Despite a modest day gain of 0.77%, the stock’s technical indicators reveal a nuanced picture that investors should carefully analyse amid evolving market conditions.
Read full news article Announcements
Corporate Actions

No Upcoming Board Meetings

No Dividend history available

No Splits history available

No Bonus history available

No Rights history available
Quality key factors
Valuation key factors
Technicals key factors
 Technical Indicator Scale: Bearish, Mildly Bearish, Sideways, Mildly Bullish, Bullish Turned
 Shareholding Snapshot : Mar 2026
Shareholding Compare (%holding)
Non Institution
None
Held by 29 Schemes (6.43%)
Held by 151 FIIs (4.26%)
Peyush Bansal (8.8%)
Svf Ii Lightbulb (cayman) Limited (13.13%)
1.33%
Quarterly Results Snapshot (Standalone) - Mar'26 - QoQ

QoQ Growth in quarter ended Mar 2026 is 6.50% vs 12.34% in Dec 2025

QoQ Growth in quarter ended Mar 2026 is 50.38% vs 9.75% in Dec 2025
Half Yearly Results Snapshot (Standalone) - Sep'25
Not Applicable: The company has declared_date for only one period
Not Applicable: The company has declared_date for only one period
Nine Monthly Results Snapshot (Standalone) - Dec'25
Not Applicable: The company has declared_date for only one period
Not Applicable: The company has declared_date for only one period
Annual Results Snapshot (Consolidated) - Mar'26
YoY Growth in year ended Mar 2026 is 32.49% vs 22.57% in Mar 2025
YoY Growth in year ended Mar 2026 is 66.99% vs 1,792.96% in Mar 2025
About Lenskart Solutions Ltd

Company Coordinates


