
Compare LG Electronics with Similar Stocks
Dashboard
High Management Efficiency with a high ROE of 0%
The company is Net-Debt Free
Poor long term growth as Operating profit has grown by an annual rate 0% of over the last 5 years
Flat results in Mar 26
With ROE of 28.2, it has a Expensive valuation with a 17.8 Price to Book Value
Increasing Participation by Institutional Investors
With its market cap of Rs 1,08,536 cr, it is the biggest company in the sector and constitutes 71.79% of the entire sector
Stock DNA
Electronics & Appliances
INR 107,399 Cr (Large Cap)
63.00
54
0.00%
-0.63
28.23%
18.18
Total Returns (Price + Dividend) 
LG Electronics for the last several years.
Risk Adjusted Returns v/s
Returns Beta

News
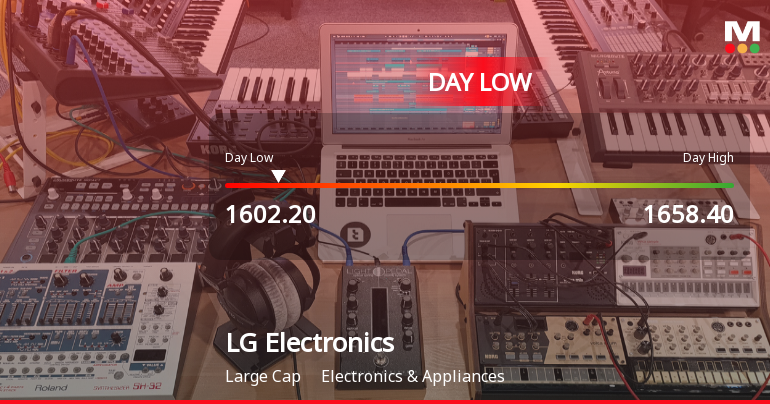
LG Electronics India Ltd Hits Intraday Low Amid Price Pressure on 22 Jun 2026
LG Electronics India Ltd experienced a notable intraday decline on 22 Jun 2026, touching a low of Rs 1602.3, down 3.02% from its previous close. This drop comes after a five-day streak of gains, marking a reversal in the stock’s recent upward momentum despite broader market advances.
Read full news article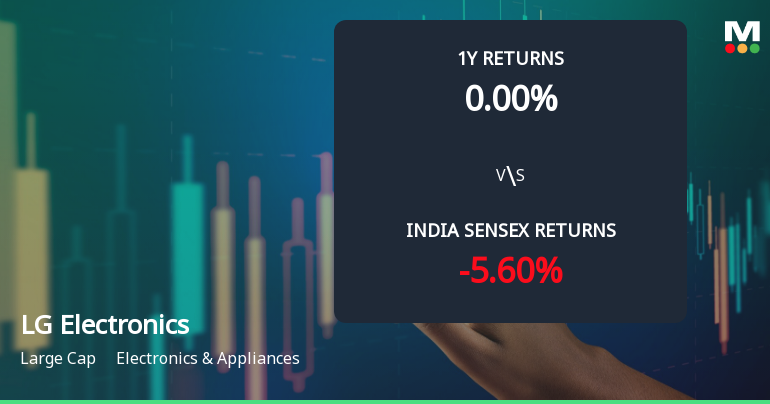
LG Electronics India Ltd Shows Renewed Momentum with Technical Upgrades and Strong Returns
LG Electronics India Ltd has demonstrated a notable shift in price momentum, transitioning from a sideways trend to a mildly bullish stance, supported by a confluence of technical indicators. The stock’s recent performance, combined with improved technical signals such as MACD, Bollinger Bands, and Dow Theory, suggests a cautiously optimistic outlook for investors in the Electronics & Appliances sector.
Read full news article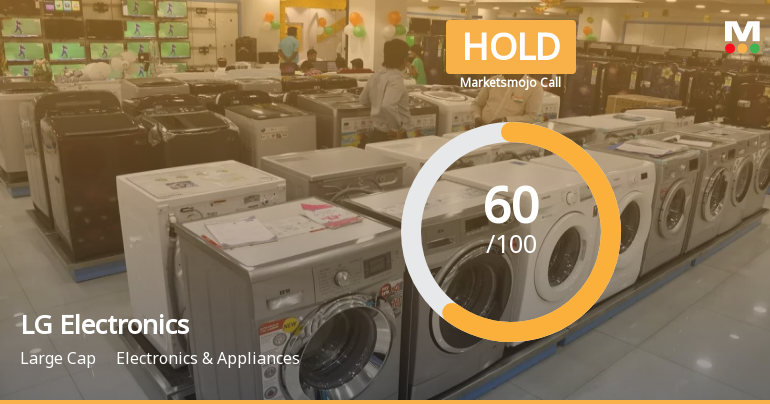
LG Electronics India Ltd is Rated Hold
LG Electronics India Ltd is rated 'Hold' by MarketsMOJO, with this rating last updated on 09 June 2026. However, the analysis and financial metrics discussed here reflect the stock's current position as of 21 June 2026, providing investors with an up-to-date perspective on the company’s fundamentals, valuation, financial trends, and technical outlook.
Read full news article Announcements
Closure of Trading Window
23-Jun-2026 | Source : BSEClosure of Trading Window
Announcement under Regulation 30 (LODR)-Analyst / Investor Meet - Intimation
19-Jun-2026 | Source : BSESchedule of Analyst/Investor Meet
Announcement under Regulation 30 (LODR)-Analyst / Investor Meet - Intimation
18-Jun-2026 | Source : BSESchedule of Analyst/Investor meet
Corporate Actions

No Upcoming Board Meetings

No Dividend history available

No Splits history available

No Bonus history available

No Rights history available
Quality key factors
Valuation key factors
Technicals key factors
 Technical Indicator Scale: Bearish, Mildly Bearish, Sideways, Mildly Bullish, Bullish Turned
 Shareholding Snapshot : Mar 2026
Shareholding Compare (%holding)
Promoters
None
Held by 36 Schemes (6.01%)
Held by 126 FIIs (2.73%)
Lg Electronics Inc (85.0%)
Icici Prudential Mutual Fund - Icici Prudential Ni (1.15%)
3.73%
Quarterly Results Snapshot (Standalone) - Mar'26 - QoQ

QoQ Growth in quarter ended Mar 2026 is 95.74% vs -33.36% in Dec 2025
QoQ Growth in quarter ended Mar 2026 is 672.53% vs -76.97% in Dec 2025
Half Yearly Results Snapshot (Standalone) - Sep'25
Not Applicable: The company has declared_date for only one period
Not Applicable: The company has declared_date for only one period
Nine Monthly Results Snapshot (Standalone) - Dec'25
Not Applicable: The company has declared_date for only one period
Not Applicable: The company has declared_date for only one period
Annual Results Snapshot (Standalone) - Mar'26

YoY Growth in year ended Mar 2026 is 0.98% vs 14.12% in Mar 2025
YoY Growth in year ended Mar 2026 is -23.52% vs 45.81% in Mar 2025
About LG Electronics India Ltd

Company Coordinates


