
 Price Point
Compare Libas Consumer with Similar Stocks
ScoreDashboard
Weak Long Term Fundamental Strength with a -28.46% CAGR growth in Operating Profits over the last 5 years
- The company has been able to generate a Return on Equity (avg) of 8.38% signifying low profitability per unit of shareholders funds
Negative results in Jun 26
With ROE of 3.1, it has a Very Expensive valuation with a 0.4 Price to Book Value
Below par performance in long term as well as near term
Mojo ParametersStock DNA

Garments & Apparels

INR 32 Cr (Micro Cap)

17.00
29

0.00%

0.07

3.05%

0.37
Total ReturnsTotal Returns (Price + Dividend) 
Latest dividend: 0.07765084473049076 per share ex-dividend date: Sep-06-2021
Risk Adjusted Returns v/s
Returns Beta
 News & Corporate Actions
News
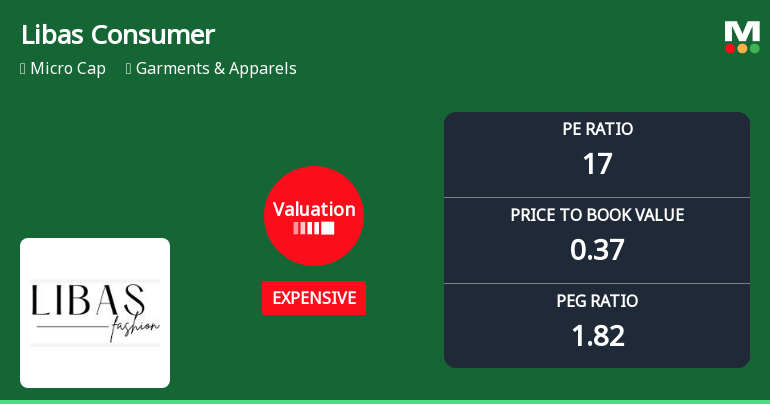
Libas Consumer Products Ltd Valuation Shifts Amidst Market Volatility
Libas Consumer Products Ltd, a micro-cap player in the Garments & Apparels sector, has experienced a notable shift in its valuation parameters, moving from a very expensive to an expensive rating. This change, coupled with a recent downgrade in its Mojo Grade to Strong Sell, highlights evolving market perceptions and raises questions about the stock’s price attractiveness relative to its peers and historical benchmarks.
Read full news article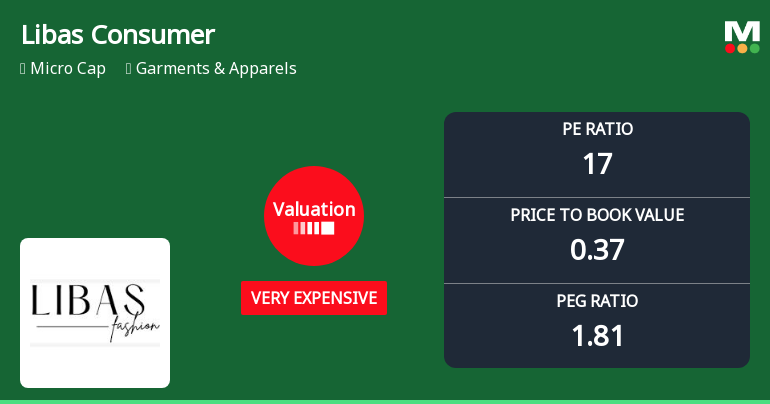
Libas Consumer Products Ltd Valuation Shifts Signal Price Attractiveness Concerns
Libas Consumer Products Ltd has seen a notable shift in its valuation parameters, moving from an expensive to a very expensive rating, despite delivering mixed returns relative to the broader market. The company’s price-to-earnings (P/E) ratio now stands at 16.64, while its price-to-book value (P/BV) remains low at 0.37, signalling a complex valuation landscape for investors in the garments and apparels sector.
Read full news article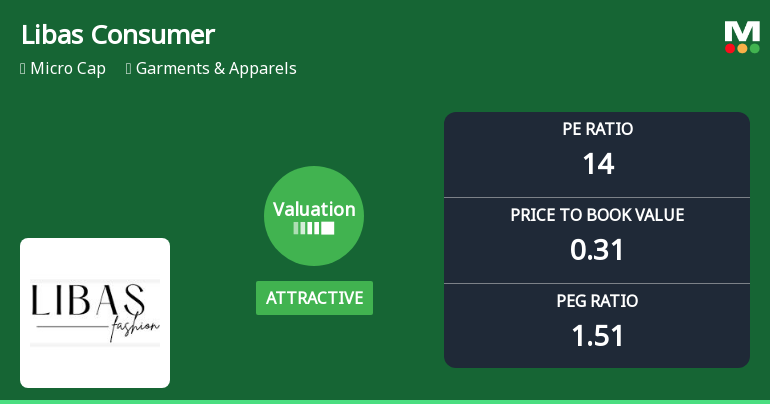
Libas Consumer Products Ltd: Valuation Shifts Signal Renewed Price Attractiveness Amidst Market Challenges
Libas Consumer Products Ltd, a micro-cap player in the Garments & Apparels sector, has witnessed a notable shift in its valuation parameters, moving from an expensive to an attractive territory. Despite ongoing market headwinds and a recent downgrade to a Strong Sell rating, the stock’s price-to-earnings (P/E) and price-to-book value (P/BV) ratios now present a compelling case for value-oriented investors seeking opportunities in the sector.
Read full news article Announcements
Libas Designs Limited - Investor Presentation
18-Nov-2019 | Source : NSELibas Designs Limited has informed the Exchange regarding Investor Presentation revised on account of typographical errors.
Libas Designs Limited - Financial Results Updates
15-Nov-2019 | Source : NSELibas Designs Limited has informed the Exchange that the quick results were revised on account of calculation mistake in profit after tax and EPS. All other figures remain unchanged. Further the Company has submitted a copy of revised quick results for the quarter and half year ended September 30, 2019.
Libas Designs Limited - Reply to Clarification Sought
30-Oct-2019 | Source : NSELibas Designs Limitedd with respect to announcement dated 19-Oct-2019, regarding Board meeting held on October 19, 2019. On basis of above the Company was required to clarify following: 1. Brief profile (in case of appointment). The response of the Company is attached.
Corporate Actions

No Upcoming Board Meetings

Libas Consumer Products Ltd has declared 1% dividend, ex-date: 06 Sep 21

No Splits history available

Libas Consumer Products Ltd has announced 1:5 bonus issue, ex-date: 21 Sep 21

Libas Consumer Products Ltd has announced 1:2 rights issue, ex-date: 15 Sep 22
Key FactorsQuality key factors
Valuation key factors
Technicals key factors
 Technical Indicator Scale: Bearish, Mildly Bearish, Sideways, Mildly Bullish, Bullish Turned Shareholding
Shareholding Snapshot : Jun 2026
Shareholding Compare (%holding)
Non Institution
None
Held by 0 Schemes
Held by 0 FIIs
Riyaz Eqbal Ahmed Ganji (16.71%)
Rakesh Kumar Mandal (3.79%)
61.25%
FinancialQuarterly Results Snapshot (Consolidated) - Jun'26 - YoY
 Compare with Peers
YoY Growth in quarter ended Jun 2026 is -30.22% vs -2.88% in Jun 2025

YoY Growth in quarter ended Jun 2026 is 103.03% vs -199.40% in Jun 2025

Half Yearly Results Snapshot (Consolidated) - Sep'25
Growth in half year ended Sep 2025 is -0.05% vs 15.87% in Sep 2024
Growth in half year ended Sep 2025 is -116.47% vs 1,233.33% in Sep 2024
Nine Monthly Results Snapshot (Consolidated) - Dec'25
YoY Growth in nine months ended Dec 2025 is 0.59% vs 16.84% in Dec 2024
YoY Growth in nine months ended Dec 2025 is -26.55% vs 0.89% in Dec 2024
Annual Results Snapshot (Consolidated) - Mar'26
YoY Growth in year ended Mar 2026 is -15.05% vs 23.72% in Mar 2025
YoY Growth in year ended Mar 2026 is -92.05% vs -49.33% in Mar 2025
 Company CV
About Libas Consumer Products Ltd










