
Compare Likhitha Infra. with Similar Stocks
Dashboard
Poor long term growth as Operating profit has grown by an annual rate -4.06% of over the last 5 years
The company has declared negative results for the last 4 consecutive quarters
Despite the size of the company, domestic mutual funds hold only 0% of the company
Underperformed the market in the last 1 year
Total Returns (Price + Dividend) 
Latest dividend: 1.5 per share ex-dividend date: Sep-20-2023
Risk Adjusted Returns v/s
Returns Beta

News
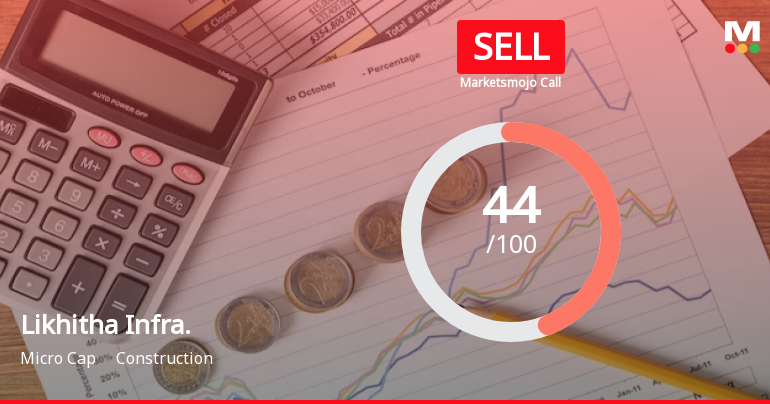
Likhitha Infrastructure Ltd is Rated Sell
Likhitha Infrastructure Ltd is rated Sell by MarketsMOJO, with this rating last updated on 06 July 2026. However, the analysis and financial metrics presented here reflect the stock’s current position as of 16 July 2026, providing investors with the most up-to-date insight into the company’s fundamentals, returns, and overall outlook.
Read full news article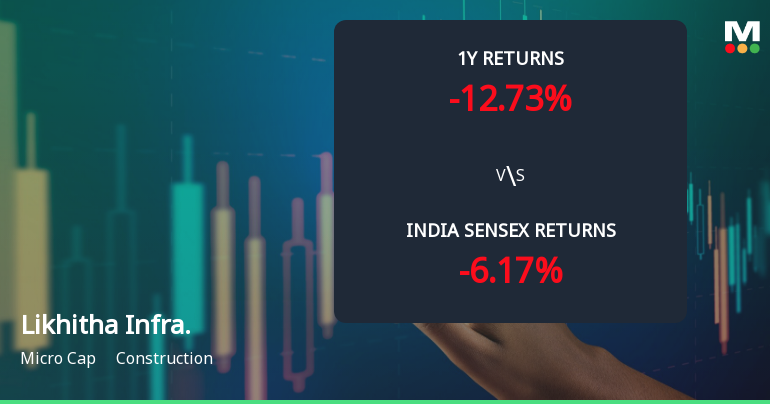
Likhitha Infrastructure Ltd Technical Momentum Shifts Amid Mixed Market Signals
Likhitha Infrastructure Ltd has experienced a notable shift in its technical momentum, with key indicators signalling a transition from bullish to mildly bullish trends. Despite a recent downgrade in its Mojo Grade to Sell, the stock’s price action and technical parameters reveal a complex picture that investors should carefully analyse amid mixed signals from momentum oscillators and moving averages.
Read full news article
Likhitha Infrastructure Ltd is Rated Hold
Likhitha Infrastructure Ltd is rated 'Hold' by MarketsMOJO, with this rating last updated on 23 June 2026. However, the analysis and financial metrics discussed here reflect the company’s current position as of 05 July 2026, providing investors with the latest insights into its performance and outlook.
Read full news article Announcements
Corporate Actions

No Upcoming Board Meetings

Likhitha Infrastructure Ltd has declared 30% dividend, ex-date: 20 Sep 23

Likhitha Infrastructure Ltd has announced 5:10 stock split, ex-date: 02 Dec 22

No Bonus history available

No Rights history available
Quality key factors
Valuation key factors
Technicals key factors
 Technical Indicator Scale: Bearish, Mildly Bearish, Sideways, Mildly Bullish, Bullish Turned
 Shareholding Snapshot : Mar 2026
Shareholding Compare (%holding)
Promoters
None
Held by 0 Schemes
Held by 6 FIIs (0.1%)
Srinivasa Rao Gaddipati (68.38%)
None
25.79%
Quarterly Results Snapshot (Consolidated) - Mar'26 - QoQ

QoQ Growth in quarter ended Mar 2026 is 8.34% vs 8.96% in Dec 2025
QoQ Growth in quarter ended Mar 2026 is -50.43% vs -19.62% in Dec 2025
Half Yearly Results Snapshot (Consolidated) - Sep'25
Growth in half year ended Sep 2025 is -13.03% vs 29.93% in Sep 2024
Growth in half year ended Sep 2025 is -26.41% vs 9.40% in Sep 2024
Nine Monthly Results Snapshot (Consolidated) - Dec'25
YoY Growth in nine months ended Dec 2025 is -12.34% vs 28.04% in Dec 2024
YoY Growth in nine months ended Dec 2025 is -32.82% vs 8.37% in Dec 2024
Annual Results Snapshot (Consolidated) - Mar'26
YoY Growth in year ended Mar 2026 is -12.18% vs 23.34% in Mar 2025
YoY Growth in year ended Mar 2026 is -43.46% vs 5.99% in Mar 2025
About Likhitha Infrastructure Ltd

Company Coordinates


